For most dogs, their friend groups usually consist of a mix of humans and other dogs. But Lili, a 3-year-old dog who lives on a French Polynesian atoll called Fakarava, isn’t like most other dogs. She prefers friends who have gills and fins. In fact, her very best friend is a shark.
Ever since Lili’s mom, Emmanuelle Larchet, adopted Lili, she’s known that her dog has an affinity for all things aquatic. She started swimming in the lagoon near Larchet’s house when she was only a month old.
“She’s really a water dog,” Larchet told The Dodo.
There are around 100 sharks who live in this lagoon near Larchet’s house. So when Lili swims in the water there, she’s surrounded by them. While many dog parents would be terrified to see their dog swimming amongst sharks, Larchet knows that the sharks Lili swims with are nurse sharks, who are actually very docile creatures.
“We call them sea puppies because [they’re] like dogs, actually … They are very nice,” Larchet said.
Larchet likes to joke that when Lili swims around with her shark friends, it’s sea puppies meeting earth puppies.
Over the years Lili has been swimming in the lagoon, there’s one shark in particular she’s grown especially close with. His name is Sharky, and he and Lili visit each other almost every day. Larchet and Lili are able to recognize Sharky because he has a special marking on one of his fins.
Lili and Sharky like to explore their lagoon together. They enjoy splashing around in the warm, clear water.
“He comes to say hello every time she sees him,” Larchet said.
Even though Lili and Larchet are best friends themselves, Larchet is more than happy to share her Lili with Sharky. And even though Larchet watches Lili hang out with her shark friends all the time, it never gets old seeing them spend time together.
“[When] I see her swimming with Sharky, [I’m] so happy,” Larchet said.
I follow Patrice Ayme and have done for many years. Some of his posts are super-intellectual and those I struggle to understand.
But a post published on September 8th, 2024 was very easy for me, and countless others no doubt, to understand and I have pleasure in republishing it on Learning from Dogs today.
I doubt that there are civilizations around. We are facing a galaxy devoid of intelligent aliens: little green mats out there, not little green men.
First, we don’t see them. With foreseeable technology (hibernation, nuclear propulsion, compact thermonuclear reactors, bioengineering, AI, quantum computers) we should be able to send very large interstellar spaceships at 1,000 kilometers per second… Thus it would take a millennium to colonize the Centaur tri-star system…. 25,000 years to colonize a 200 light years across ball… And the entire galaxy in ten million years… Wars would only accelerate the expansion. So if there was a galactic civilization, within ten million years it would have spanned the entire galaxy and its presence should be in sight.
Second, life took nearly four billion years to evolve animals. Bacterial life could have been nearly extinguished on Earth many times…. Be it only during the Snowball Earths episodes. A star whizzing by could have launched a thousand large comets. The large planets could have fallen inward.
Third, ultra intelligent life may not be able to have hands or tentacles and thus develop industry. Once intelligent life forms have evolved, say sea lions or parrots, let alone wolves, they may just be sitting ducks for the next disaster which would revert life to the bacterial level, erasing billions of years of evolution.
Fourth, when civilization is launched, it can fail… And not get a second chance (from lack of availability of mines after easy picking during the initial civilization).
So I don’t expect little green men… Besides those sent by the perverse Putin…
Just when we thought we knew of all the stress, here is another one: if we go extinct, the universe loses its soul! We have thus found a new Superior Moral Directive: SUS, Save Unique Soul!
Expect little green mats, not little green men.
Patrice Ayme
ooOOoo
A couple of weeks ago I gave a talk to our local Freethinkers group and called it The Next Ten Years. It began, thus:
This presentation is about the world of the future; of the near future. And the biggest issue, most agree, is the change in the climate.
The Global Temperature anomaly, as of last year, 2023, is 1.17 Centigrade, 2.11 Fahrenheit, above the long-term average from 1951 to 1980. The 10 most recent years are the warmest years on record.
Antoine de Saint-Exupéry is quoted as saying that ‘a goal without a plan is just a wish.’ So my plan is to show you how we can change, no let me put that more strongly, how we must change in the next ten years. Because our present habits are ruining the world.
As I said to Jeannie the broadcast really spoke to me as each morning I am in awe of the black-tailed deer that I go down to feed near the old stables just outside the house.
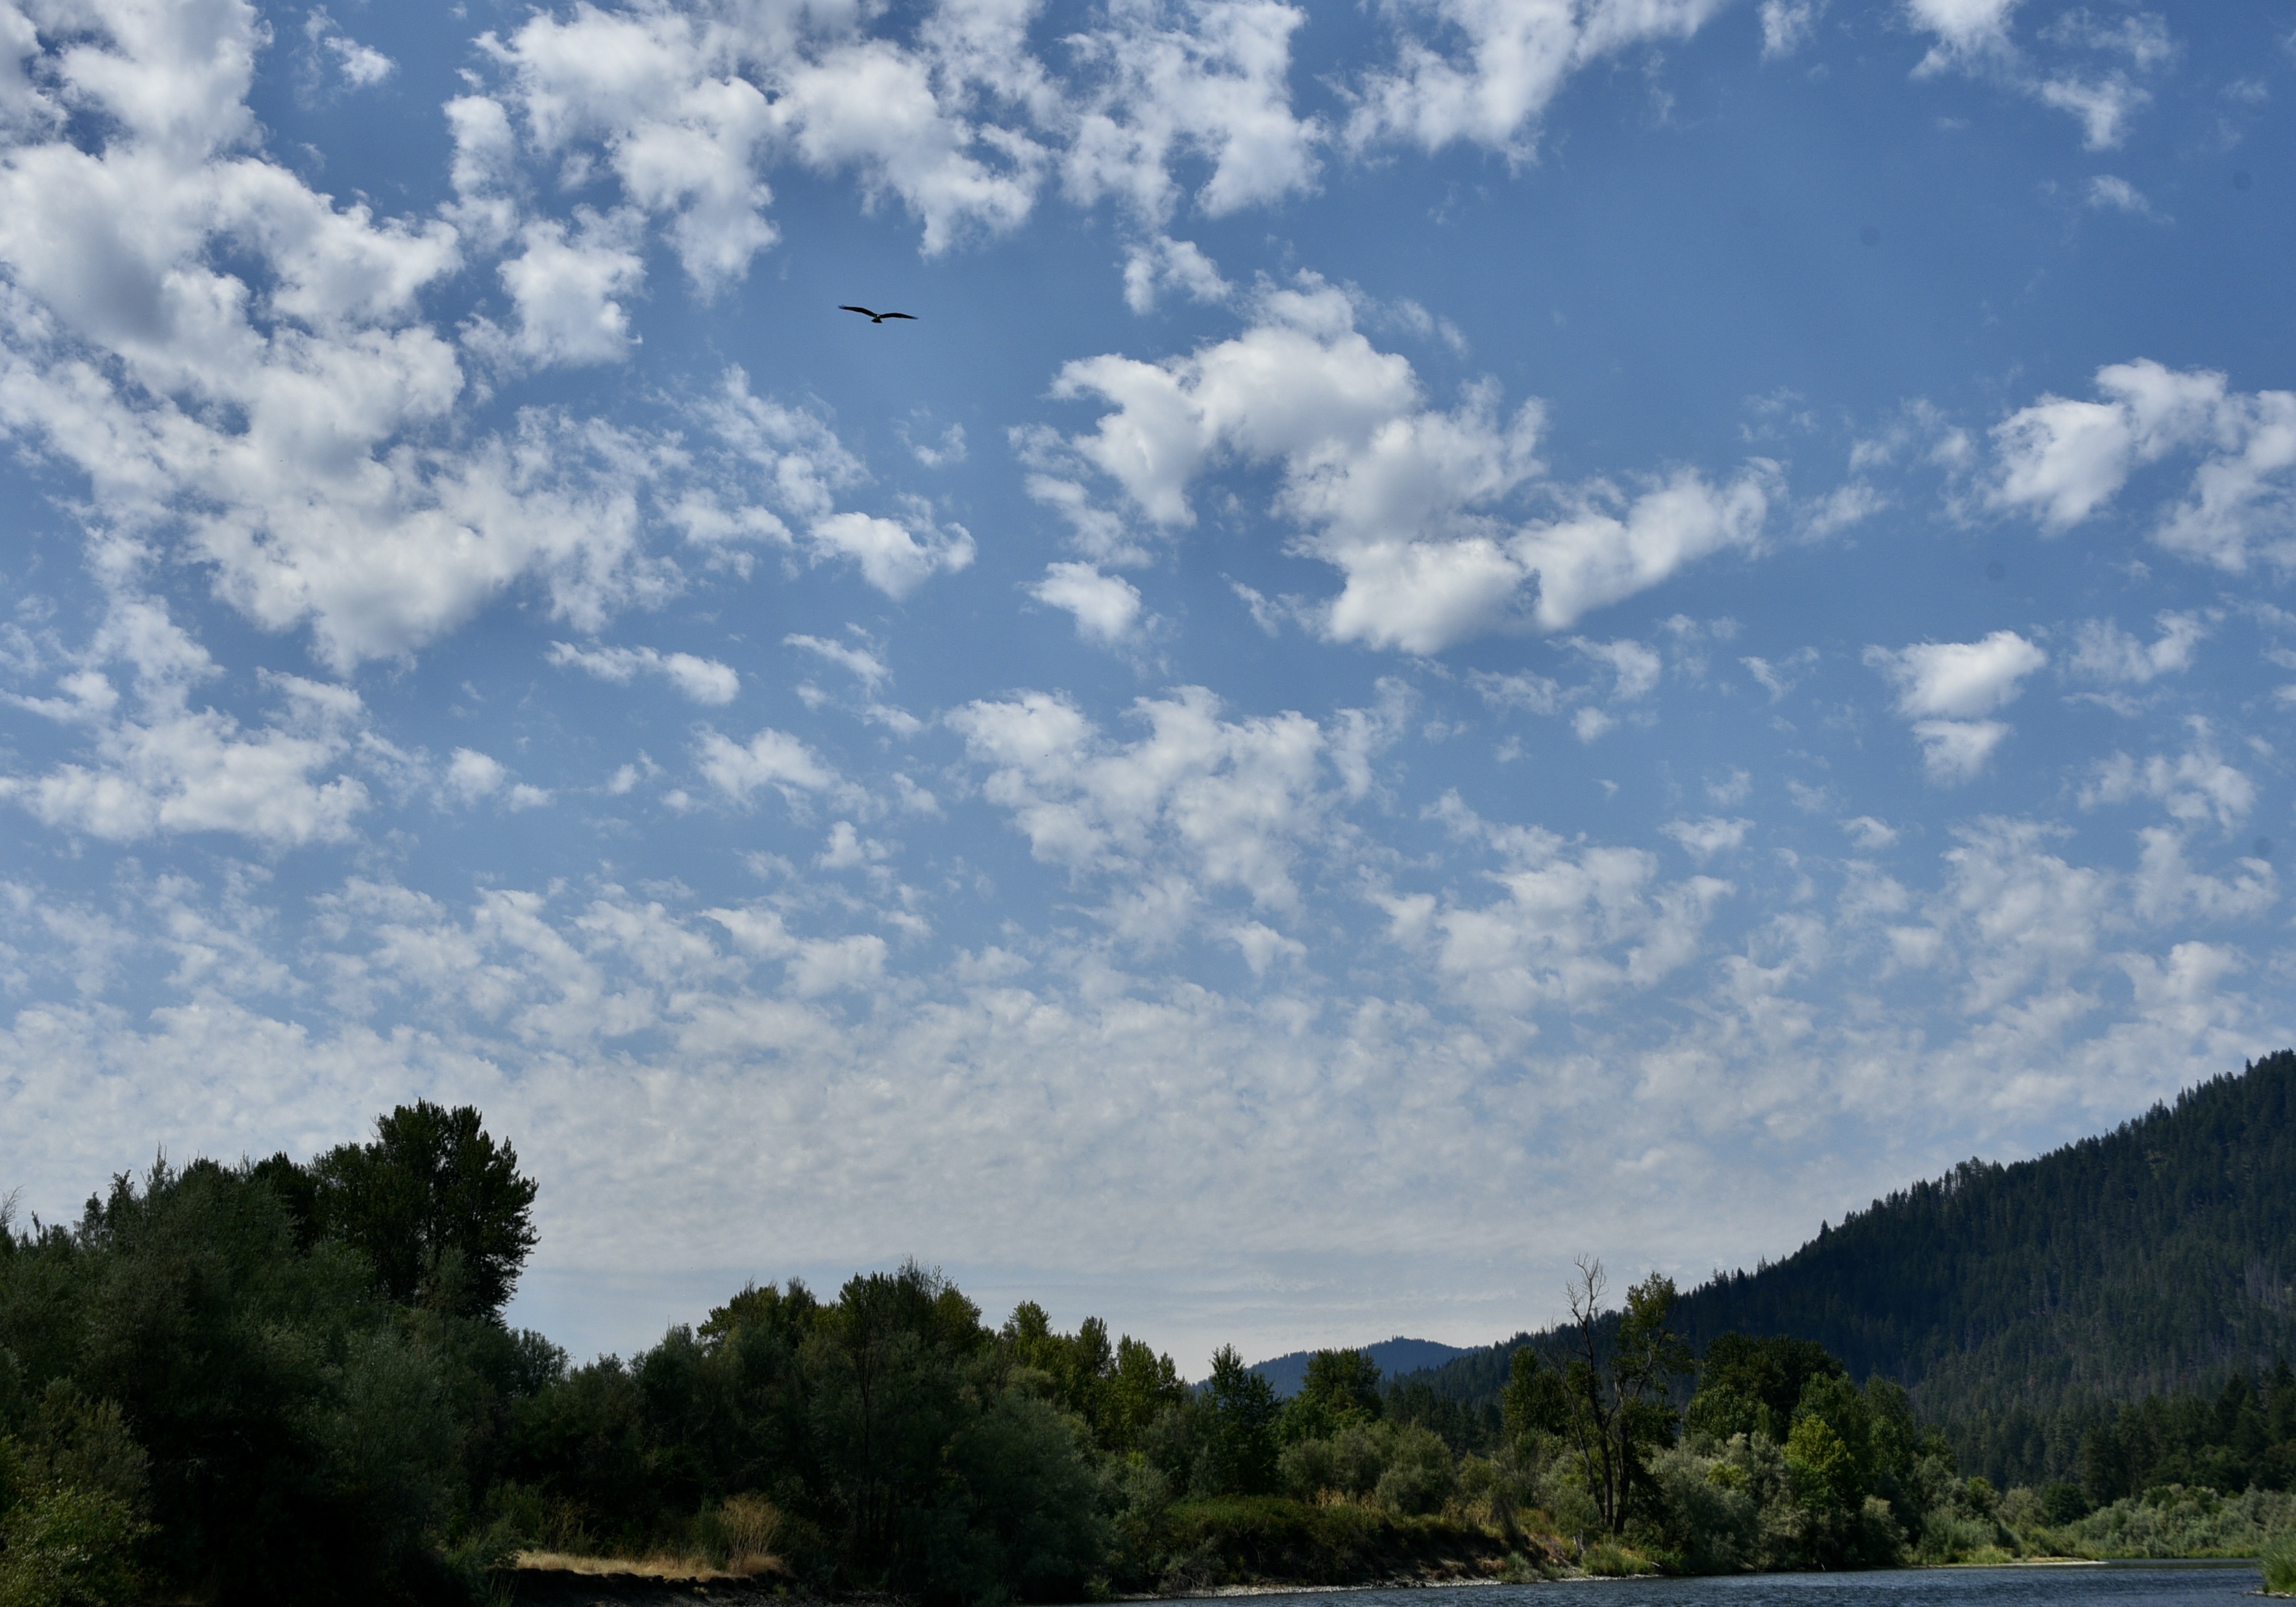
Then I pause on my way back and look at Mount Sexton and the rising sun; again I am in awe.
Then at night, being a crystal-clear sky on many occasions, I am in awe at the heavens above.
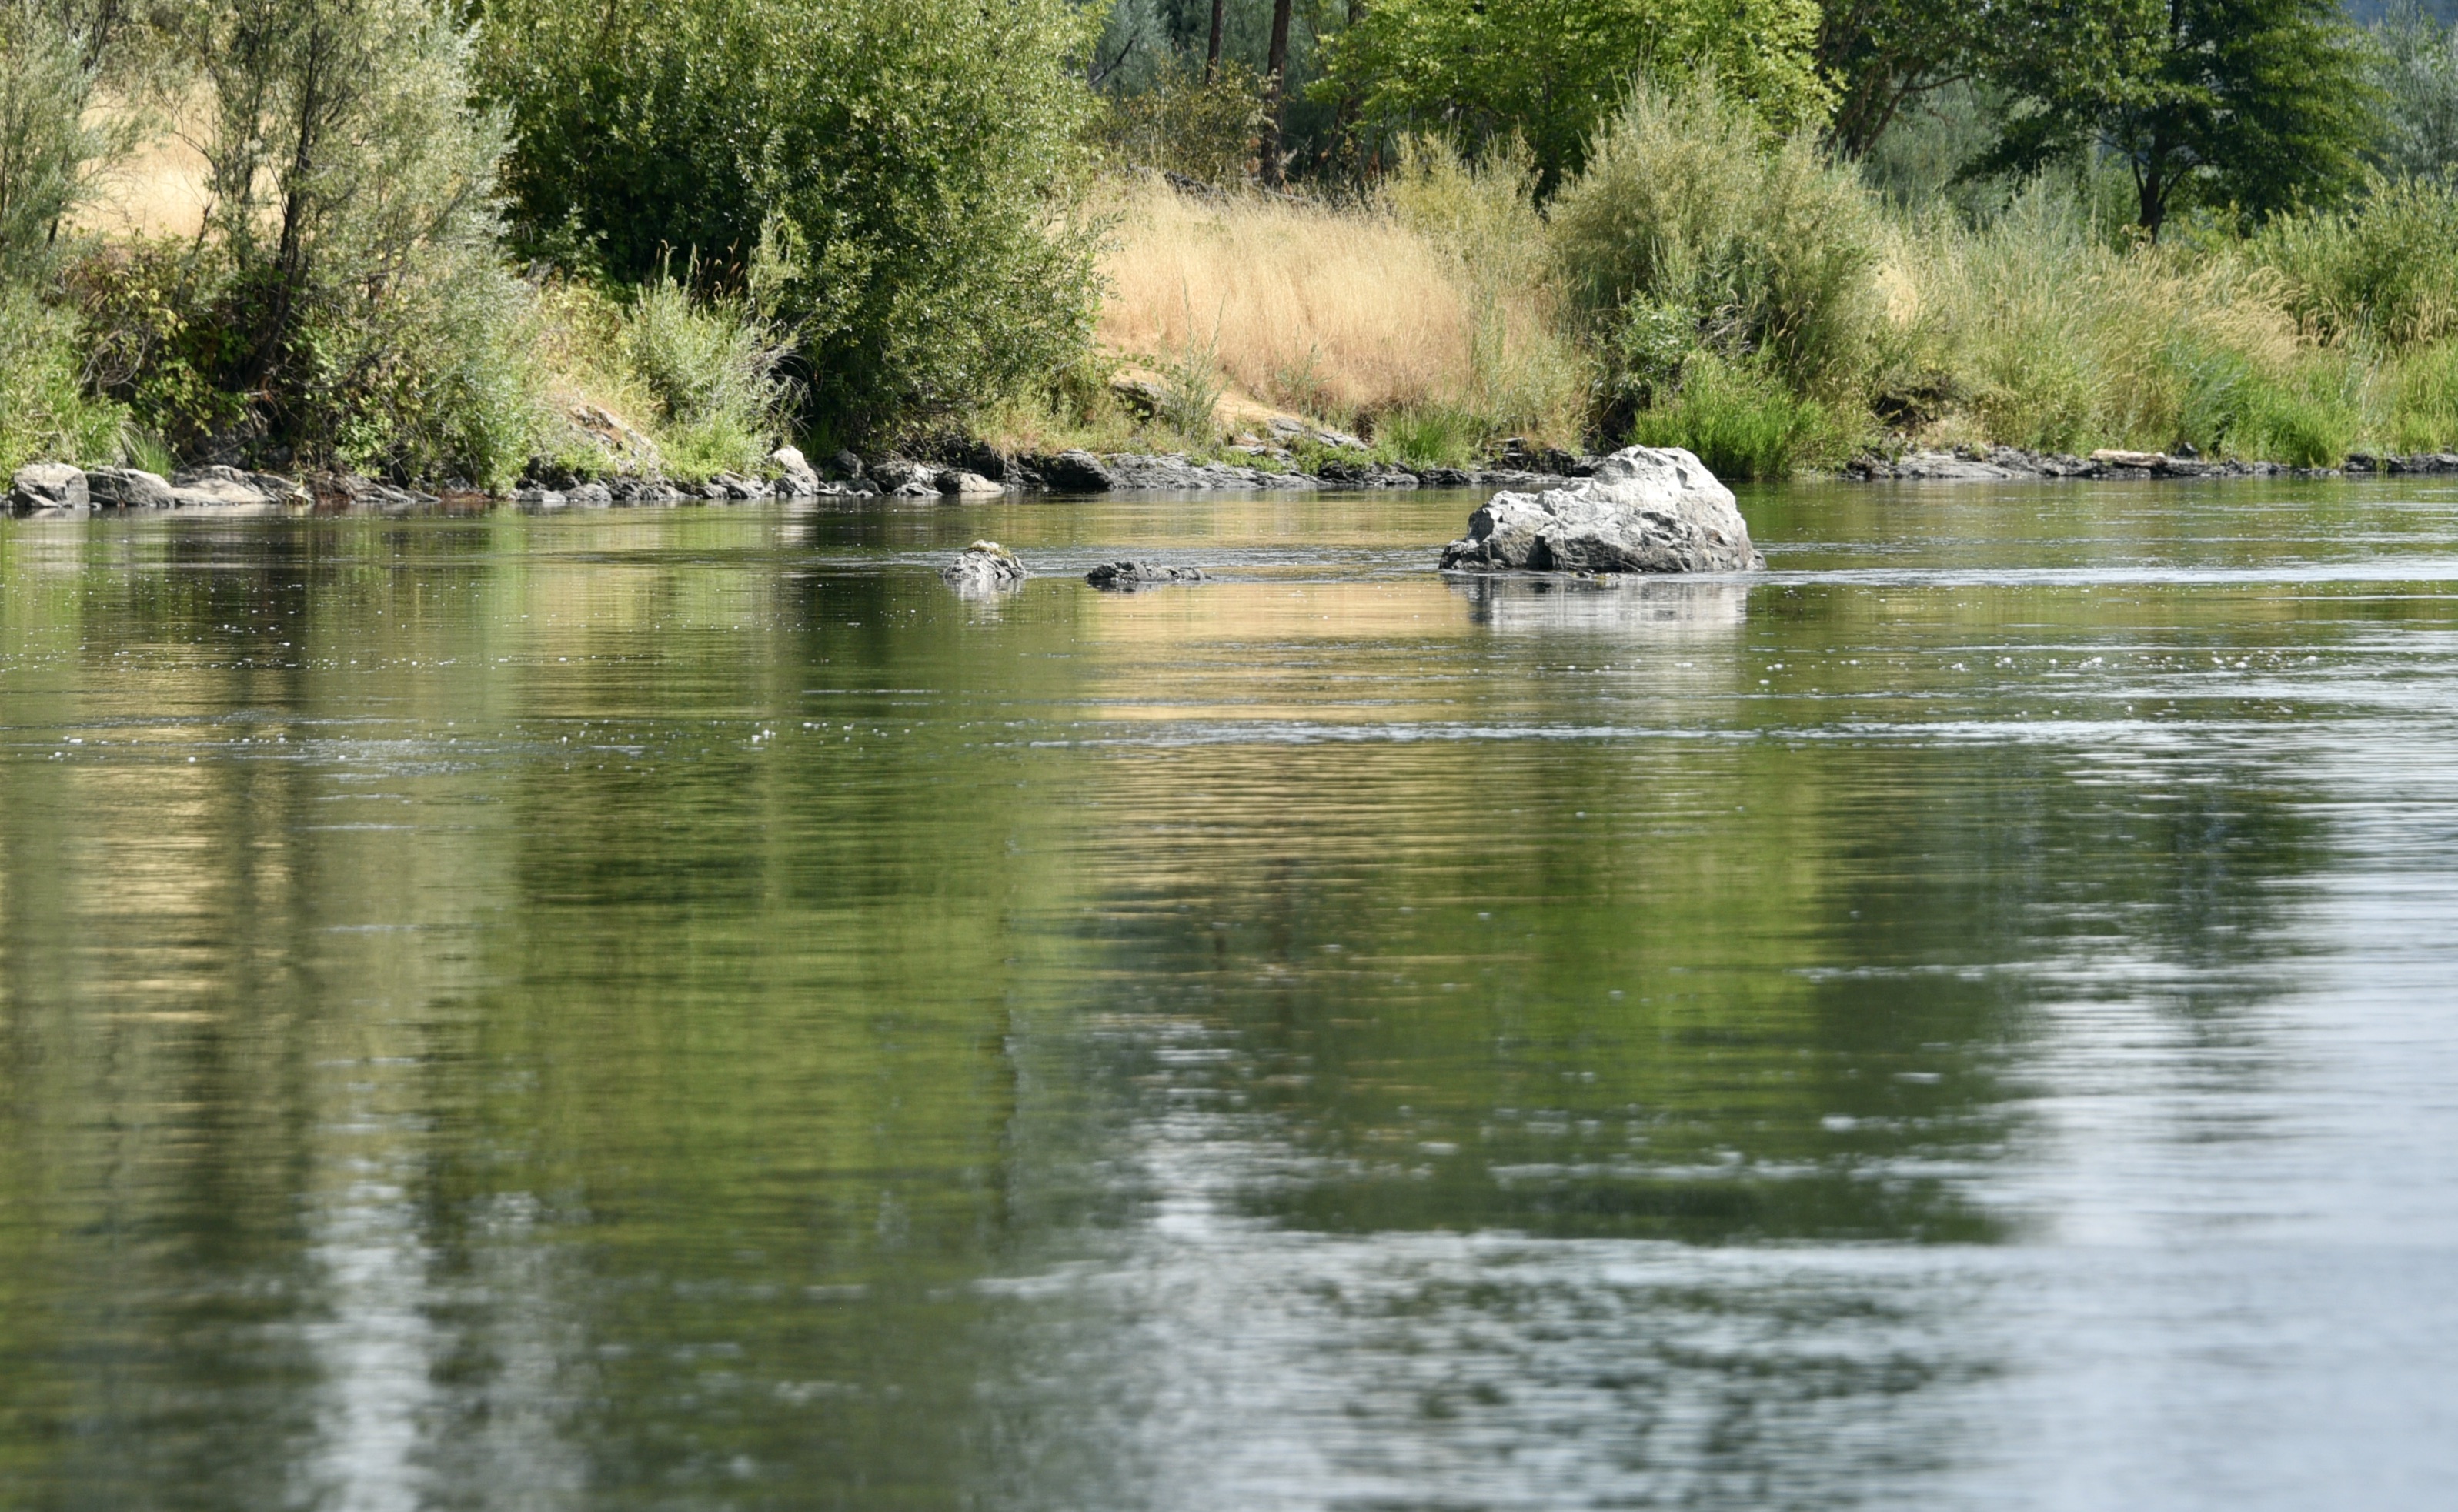
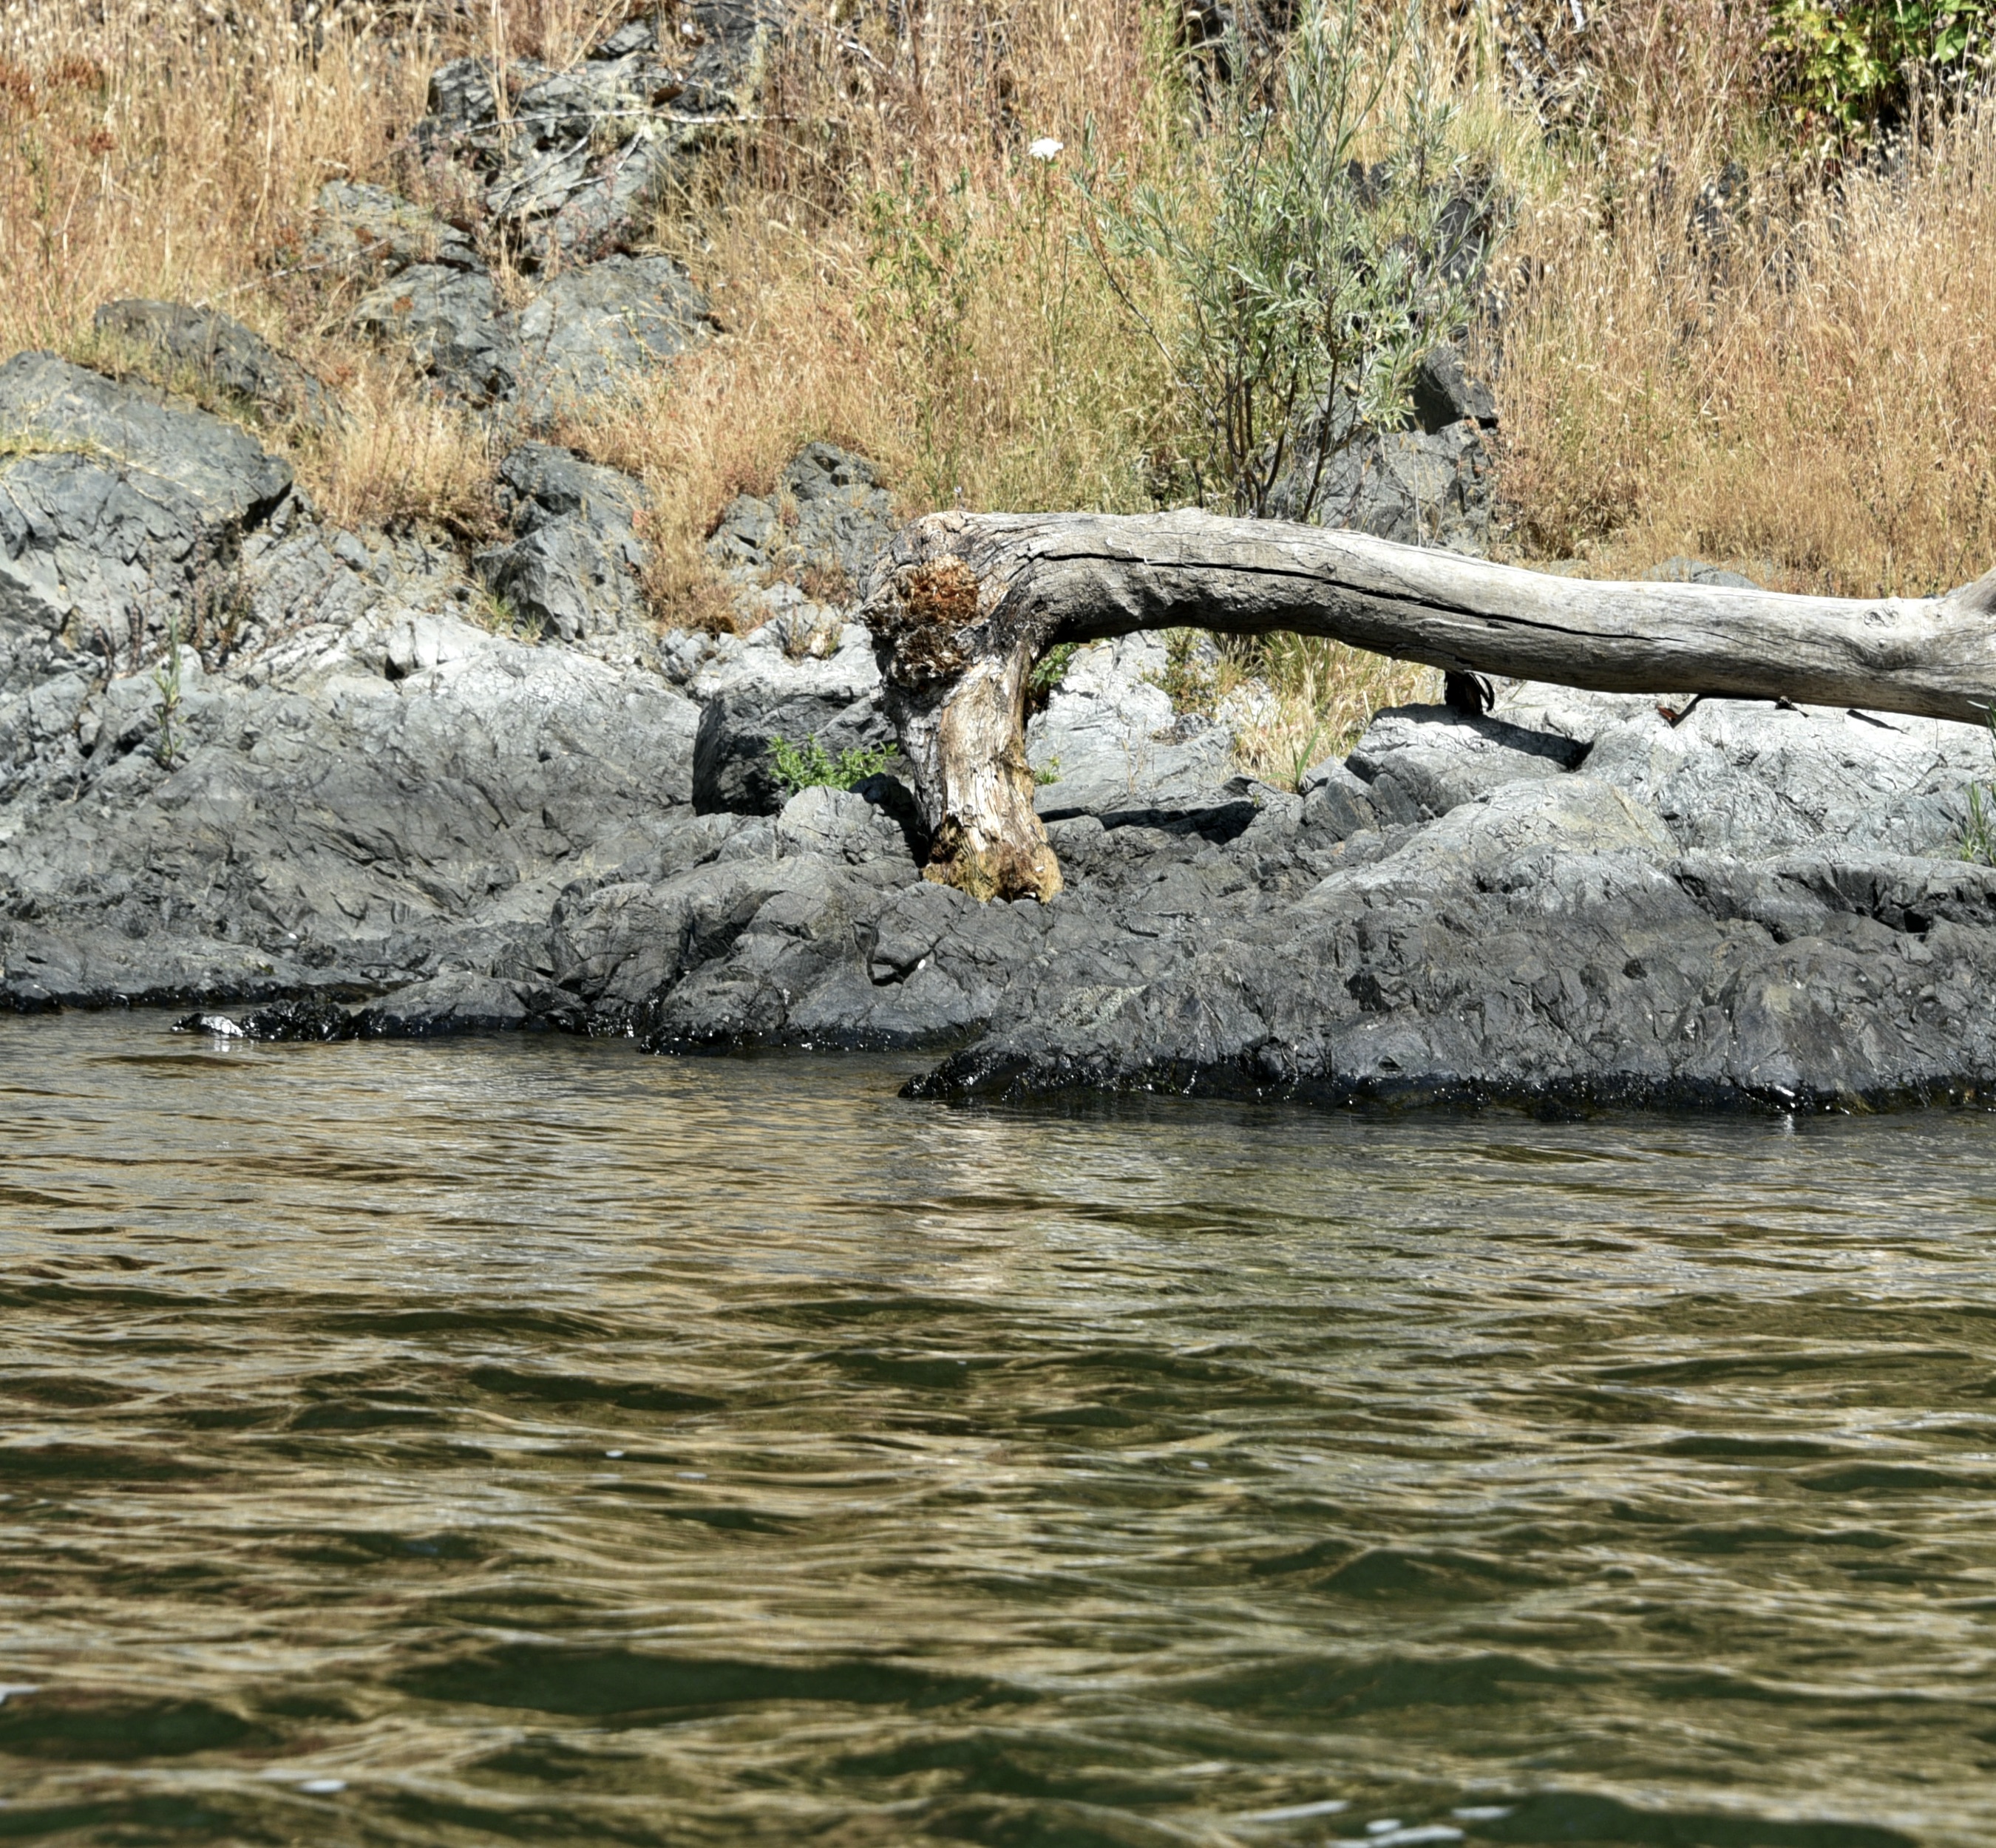
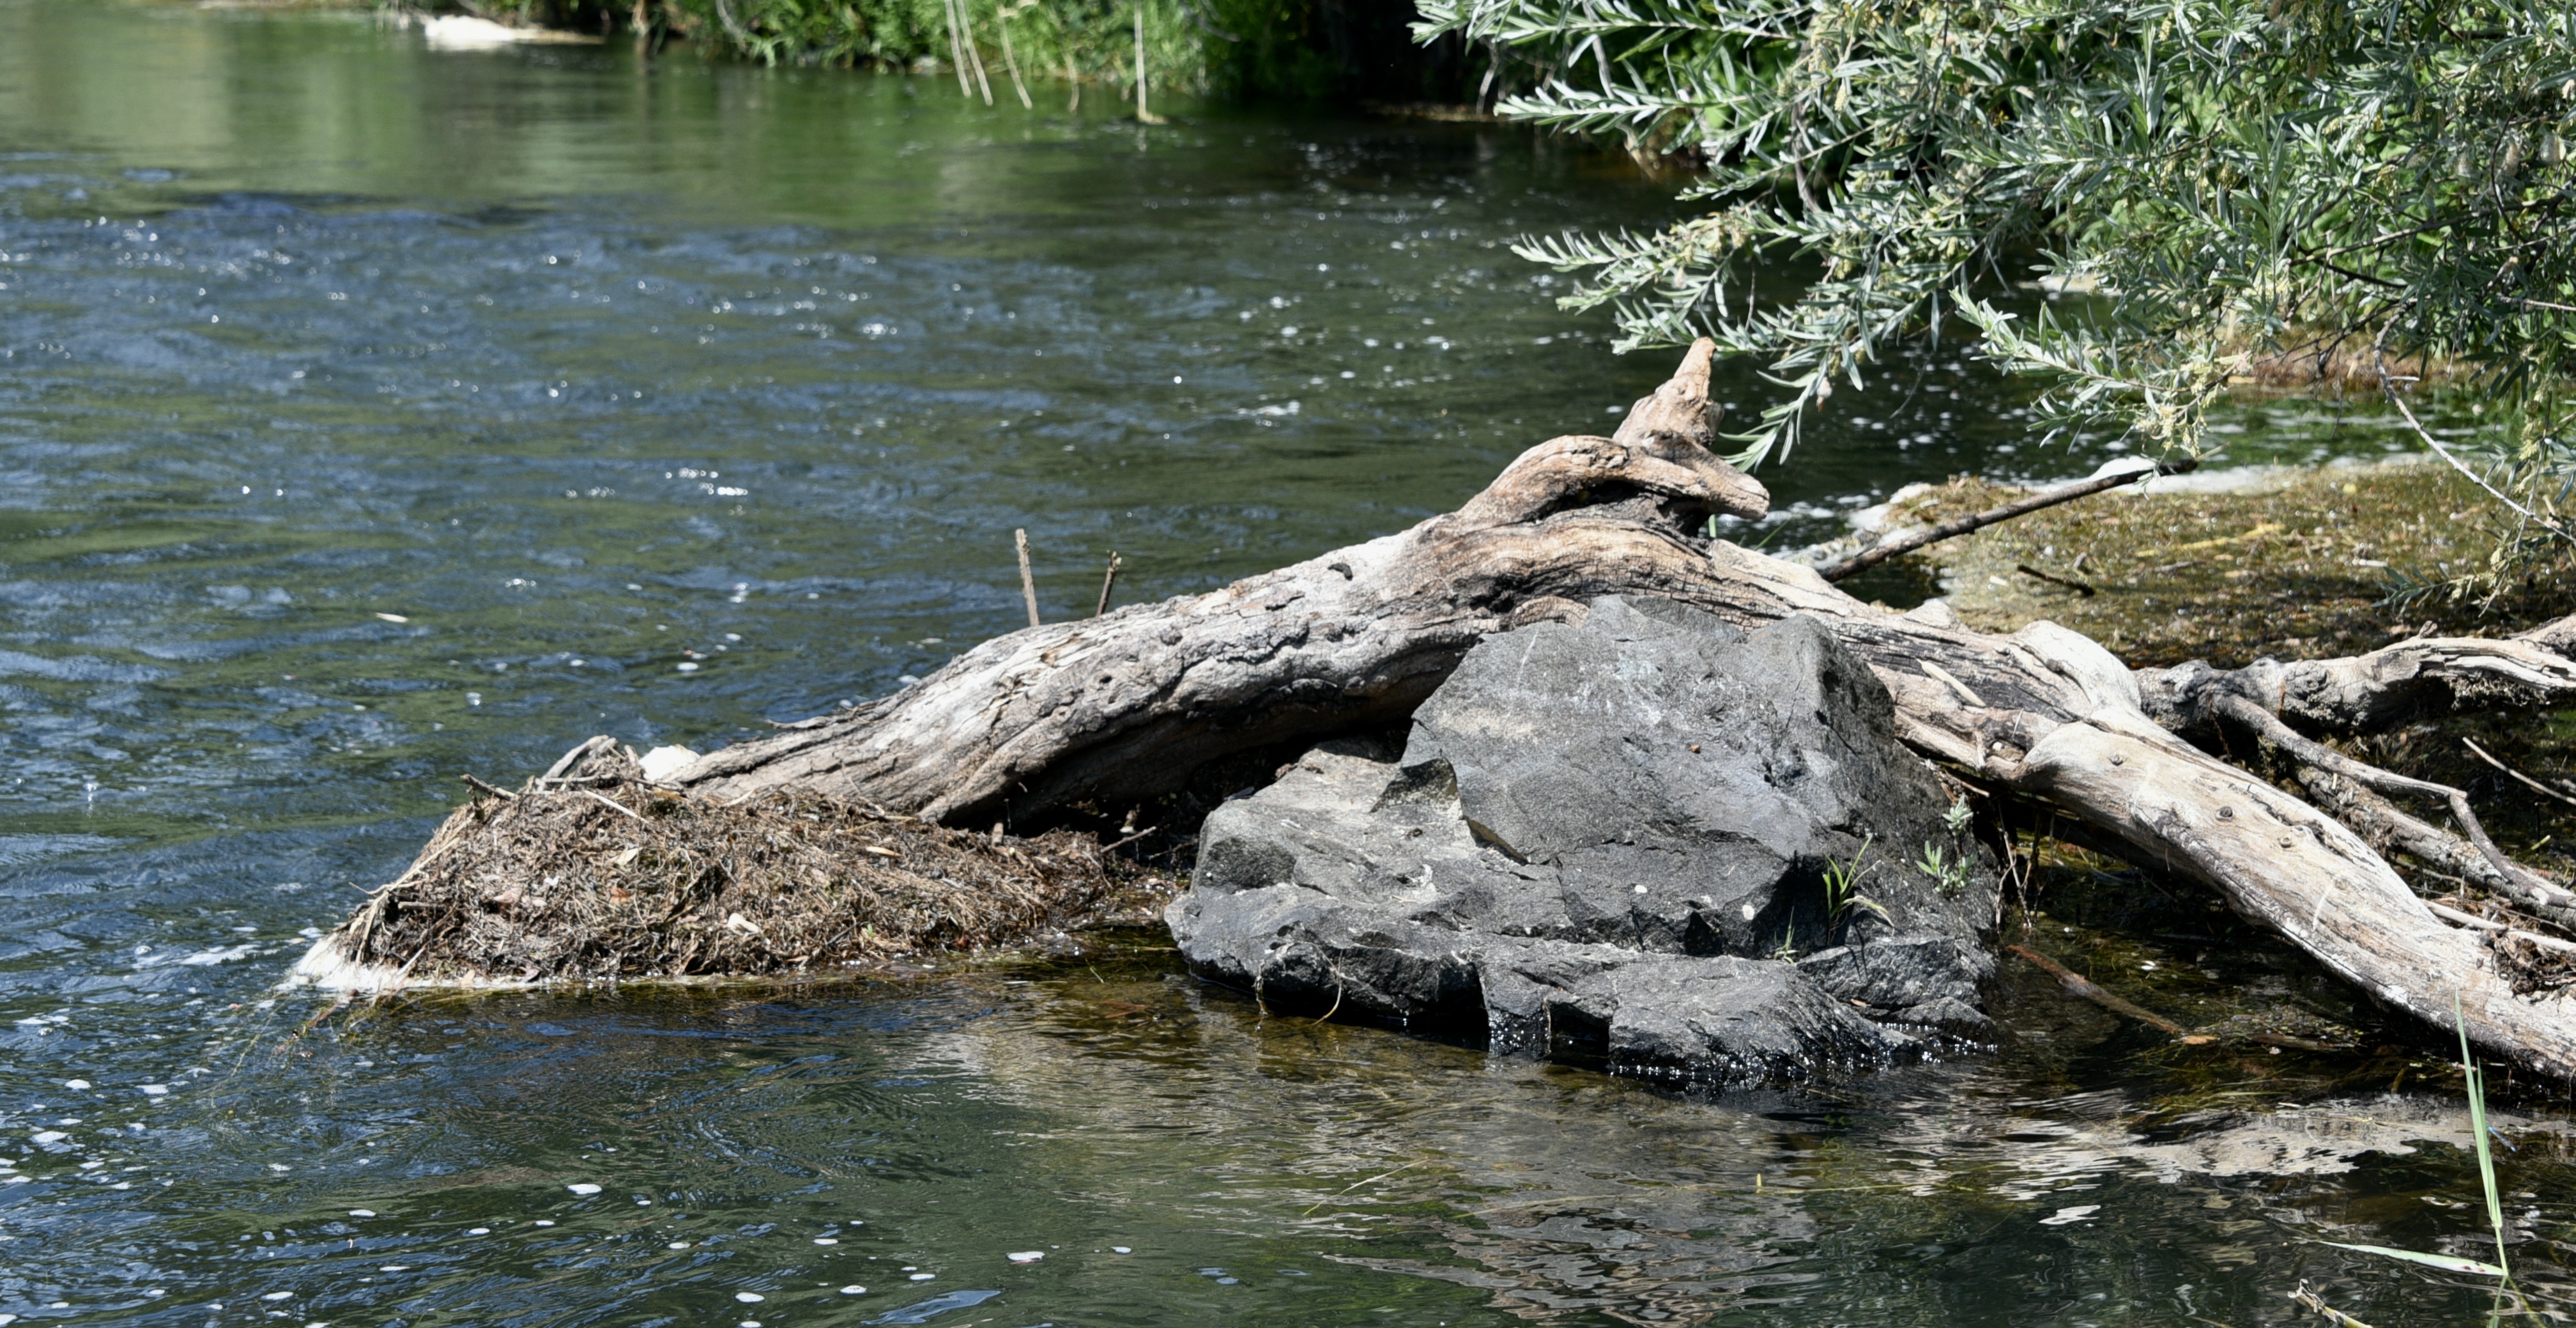
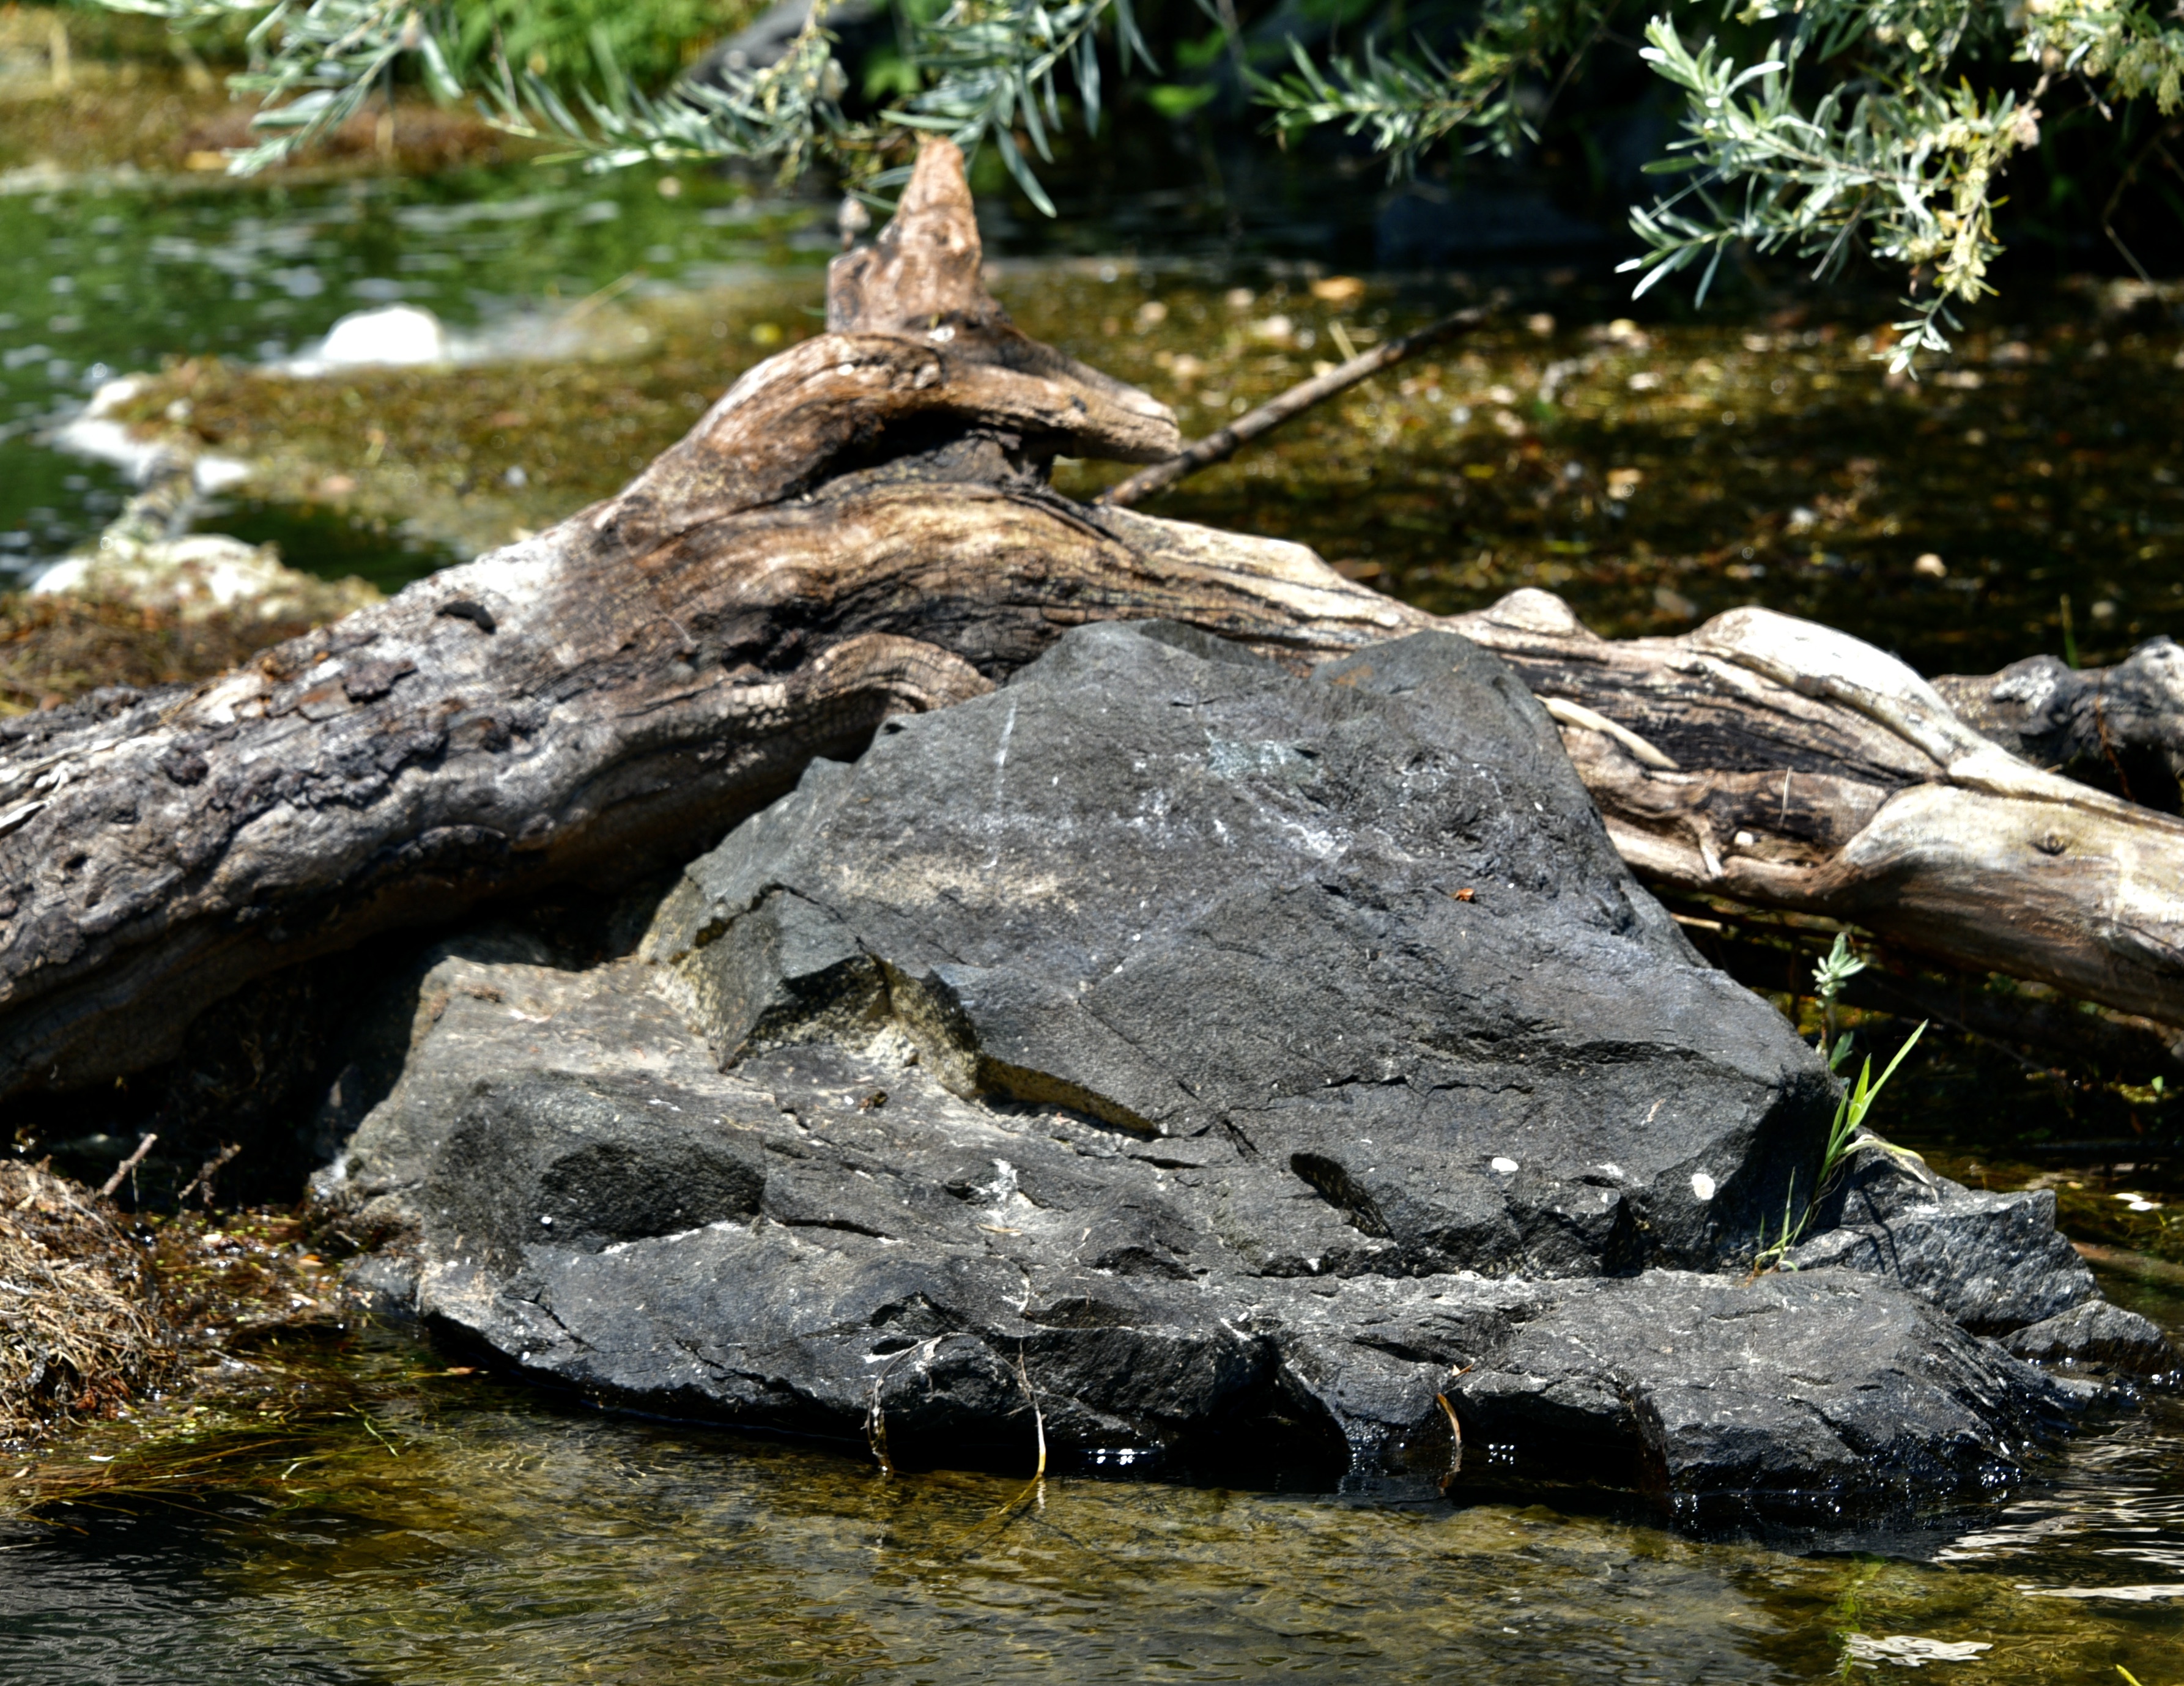
The programme spoke of one being in awe of both the small and the large and I want to close with two of my photographs of me sensing awe in both scales.
Extreme weather is by definition rare on our planet. Ferocious storms, searing heatwaves and biting cold snaps illustrate what the climate is capable of at its worst. However, since Earth’s climate is rapidly warming, predominantly due to fossil fuel burning, the range of possible weather conditions, including extremes, is changing.
Scientists define “climate” as the distribution of possible weather events observed over a length of time, such as the range of temperatures, rainfall totals or hours of sunshine. From this they construct statistical measures, such as the average (or normal) temperature. Weather varies on several timescales – from seconds to decades – so the longer the period over which the climate is analysed, the more accurately these analyses capture the infinite range of possible configurations of the atmosphere.
Typically, meteorologists and climate scientists use a 30-year period to represent the climate, which is updated every ten years. The most recent climate period is 1991-2020. The difference between each successive 30-year climate period serves as a very literal record of climate change.
This way of thinking about the climate falls short when the climate itself is rapidly changing. Global average temperatures have increased at around 0.2°C per decade over the past 30 years, meaning that the global climate of 1991 was around 0.6°C cooler than that in 2020 (when accounting for other year-to-year fluctuations), and even more so than the present day.
A moving target for climate modellers
If the climate is a range of possible weather events, then this rapid change has two implications. First, it means that part of the distribution of weather events comprising a 30-year climate period occurred in a very different background global climate: for example, northerly winds in the 1990s were much colder than those in the 2020s in north-west Europe, thanks to the Arctic warming nearly four times faster than the global average. Statistics from three decades ago no longer represent what is possible in the present day.
Second, the rapidly changing climate means we have not necessarily experienced the extremes that modern-day atmospheric and oceanic warmth can produce. In a stable climate, scientists would have multiple decades for the atmosphere to get into its various configurations and drive extreme events, such as heatwaves, floods or droughts. We could then use these observations to build up an understanding of what the climate is capable of. But in our rapidly changing climate, we effectively have only a few years – not enough to experience everything the climate has to offer.
Extreme weather events require what meteorologists might call a “perfect storm”. For example, extreme heat in the UK typically requires the northward movement of an air mass from Africa combined with clear skies, dry soils and a stable atmosphere to prevent thunderstorms forming which tend to dissipate heat.
Such “perfect” conditions are intrinsically unlikely, and many years can pass without them occurring – all while the climate continues to change in the background. Based on an understanding of observations alone, this can leave us woefully underprepared for what the climate can now do, should the right weather conditions all come together at once.
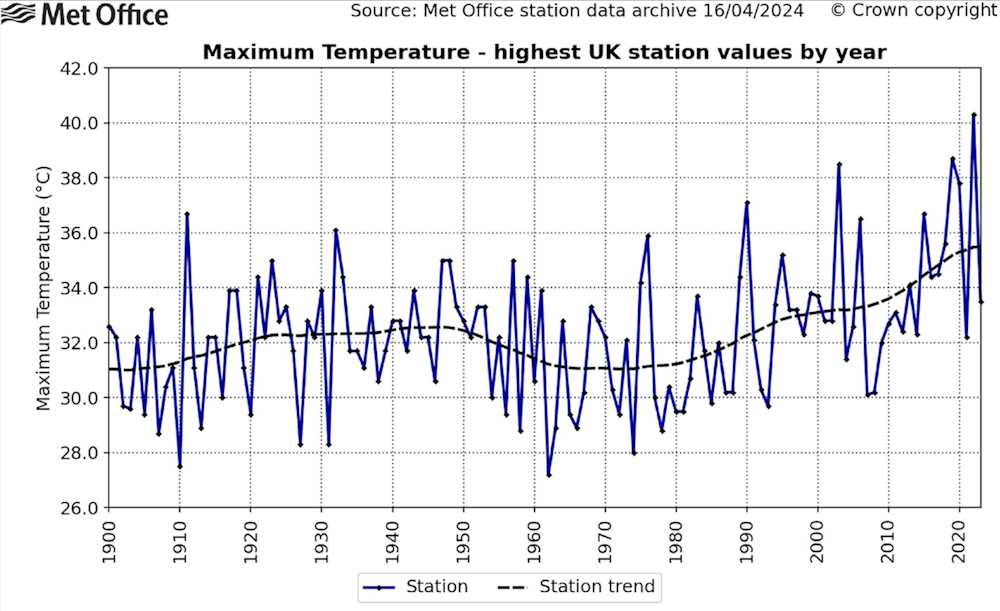
Startling recent examples include the extreme heatwave in the Pacific north-west of North America in 2021, in which temperatures exceeded the previous Canadian record maximum by 4.6°C. Another is the occurrence of 40°C in the UK in summer 2022, which exceeded the previous UK record maximum set only three years earlier by 1.6°C. This is part of the reason why the true impact of a fixed amount of global warming is only evident after several decades, but of course – since the climate is changing rapidly – we cannot use this method anymore.
Playing with fire
To better understand these extremes, scientists can use ensembles: many runs of the same weather or climate model that each slightly differ to show a range of plausible outcomes. Ensembles are routinely used in weather prediction, but can also be used to assess extreme events which could happen even if they do not actually happen at the time.
When 40°C first appeared in ensemble forecasts for the UK before the July 2022 heatwave, it revealed the kind of extreme weather that is possible in the current climate. Even if it had not come to fruition, its mere appearance in the models showed that the previously unthinkable was now possible. In the event, several naturally occurring atmospheric factors combined with background climate warming to generate the record-shattering heat on July 19 that year.
The highest observed temperature each year in the UK, from 1900 to 2023
Later in summer 2022, after the first occurrence of 40°C, some ensemble weather forecasts for the UK showed a situation in which 40°C could be reached on multiple consecutive days. This would have posed an unprecedented threat to public health and infrastructure in the UK. Unlike the previous month, this event did not come to pass, and was quickly forgotten – but it shouldn’t have been.
It is not certain whether these model simulations correctly represent the processes involved in producing extreme heat. Even so, we must heed the warning signs.
Despite a record-warm planet, summer 2024 in the UK has been relatively cool so far. The past two years have seen global temperatures far above anything previously observed, and so potential extremes have probably shifted even further from what we have so far experienced.
Just as was the case in August 2022, we’ve got away with it for now – but we might not be so lucky next time.
That last sentence says it all: “Just as was the case in August 2022, we’ve got away with it for now – but we might not be so lucky next time.”
I am giving a talk, The Next Ten Years, next Saturday to our local Freethinkers group in Grants Pass. Close to the start of the presentation I say: “The Global Temperature anomaly, as of last year, 2023, is 1.17 C, 2.11 F, above the long-term average from 1951 to 1980. The 10 most recent years are the warmest years on record.“
Finally, I am getting on in age and part of me wants to die, hopefully naturally, before more climate extremes are reached, but then another part of me would like to experience it!
The drawing depicts a turbaned cavalry soldier facing off against an English dragoon. It’s a bit trippy: The British soldier sits astride a carrot, and the turbaned soldier rides a grape. Both carrot and grape are fitted with horses’ heads and stick appendages.
‘The Battle of the Fruit and Vegetable Soldiers,’ a drawing on the back of a manuscript page from Charles Darwin’s ‘On the Origin of Species,’ attributed to Darwin’s young son Francis. Cambridge University Library, CC BY-ND
It’s thought to be the work of Francis Darwin, the seventh child of British naturalist Charles Darwin and his wife, Emma, and appears to have been made in 1857, when Frank would have been 10 or 11. And it’s drawn on the back of a page of a draft of “On the Origin of Species,” Darwin’s masterwork and the foundational text of evolutionary biology. The few sheets of the draft that survive are pages Darwin gave to his children to use for drawing paper.
Darwin’s biographers have long recognized that play was important in his personal and familial life. The Georgian manor in which he and Emma raised their 10 children was furnished with a rope swing hung over the first-floor landing and a portable wooden slide that could be laid over the main stairway. The gardens and surrounding countryside served as an open-air laboratory and playground.
Play also has a role in Darwin’s theory of natural selection. As I explain in my new book, “Kingdom of Play: What Ball-bouncing Octopuses, Belly-flopping Monkeys, and Mud-sliding Elephants Reveal about Life Itself,” there are many similarities – so many that if you could distill the processes of natural selection into a single behavior, that behavior would be play.
Through natural selection, the rock pocket mouse has evolved a coat color that hides it from predators in the desert Southwest.
In contrast to foraging and hunting – behaviors with clearly defined goals – play is likewise undirected. When a pony frolics in a field, a dog wrestles with a stick or chimpanzees chase each other, they act with no goal in mind.
Natural selection is utterly provisional: The evolution of any organism responds to whatever conditions are present at a given place and time. Likewise, animals at play are acting provisionally. They constantly adjust their movements in response to changes in circumstances. Playing squirrels, faced with obstacles such as falling branches or other squirrels, nimbly alter their tactics and routes.
Natural selection is open-ended. The forms of life are not fixed, but continually evolving. Play, too, is open-ended. Animals begin a play session with no plan of when to end it. Two dogs play-fighting, for instance, cease playing only when one is injured, exhausted or simply loses interest.
Keepers noticed that Shanthi, a 36-year-old elephant at the Smithsonian national zoo, liked to make noise with objects, so they gave her horns, harmonicas and other noisemakers.
Play is likewise profligate. It requires an animal to expend time and energy that perhaps would be better devoted to behaviors such as foraging and hunting that could aid survival.
And that profligacy is also advantageous. Animals forage and hunt in specific ways that don’t typically change. But an animal at play is far more likely to innovate – and some of its innovations may in time be adapted into new ways to forage and hunt.
Competing and cooperating
As Darwin first framed it, the “struggle for existence” was by and large a competition. But in the 1860s, Russian naturalist Pyotr Kropotkin’s observations of birds and fallow deer led him to conclude that many species were “the most numerous and the most prosperous” because natural selection also selects for cooperation.
Scientists confirmed Kroptokin’s hypothesis in the 20th century, discovering all manner of cooperation, not only between members of the same species but between members of different species. For example, clown fish are immune to anemone stings; they nestle in anemone tentacles for protection and, in return, keep the anemones free of parasites, provide nutrients and drive away predators.
Play likewise utilizes both competition and cooperation. Two dogs play-fighting are certainly competing, yet to sustain their play, they must cooperate. They often reverse roles: A dog with the advantage of position might suddenly surrender that advantage and roll over on its back. If one bites harder than intended, it is likely to retreat and perform a play bow – saying, in effect, “My bad. I hope we can keep playing.”
River otters at the Oregon Zoo repeatedly separate and reunite while playing in a tub of ice.
Natural selection and play also may both employ deception. From butterflies colored to resemble toxic species to wild cats that squeal like distressed baby monkeys, many organisms use mimicry to deceive their prey, predators and rivals. Play – specifically, play-fighting – similarly offers animals opportunities to learn about and practice deception.
And since natural selection shares so many features with play, we may with some justification maintain that life, in a most fundamental sense, is playful.
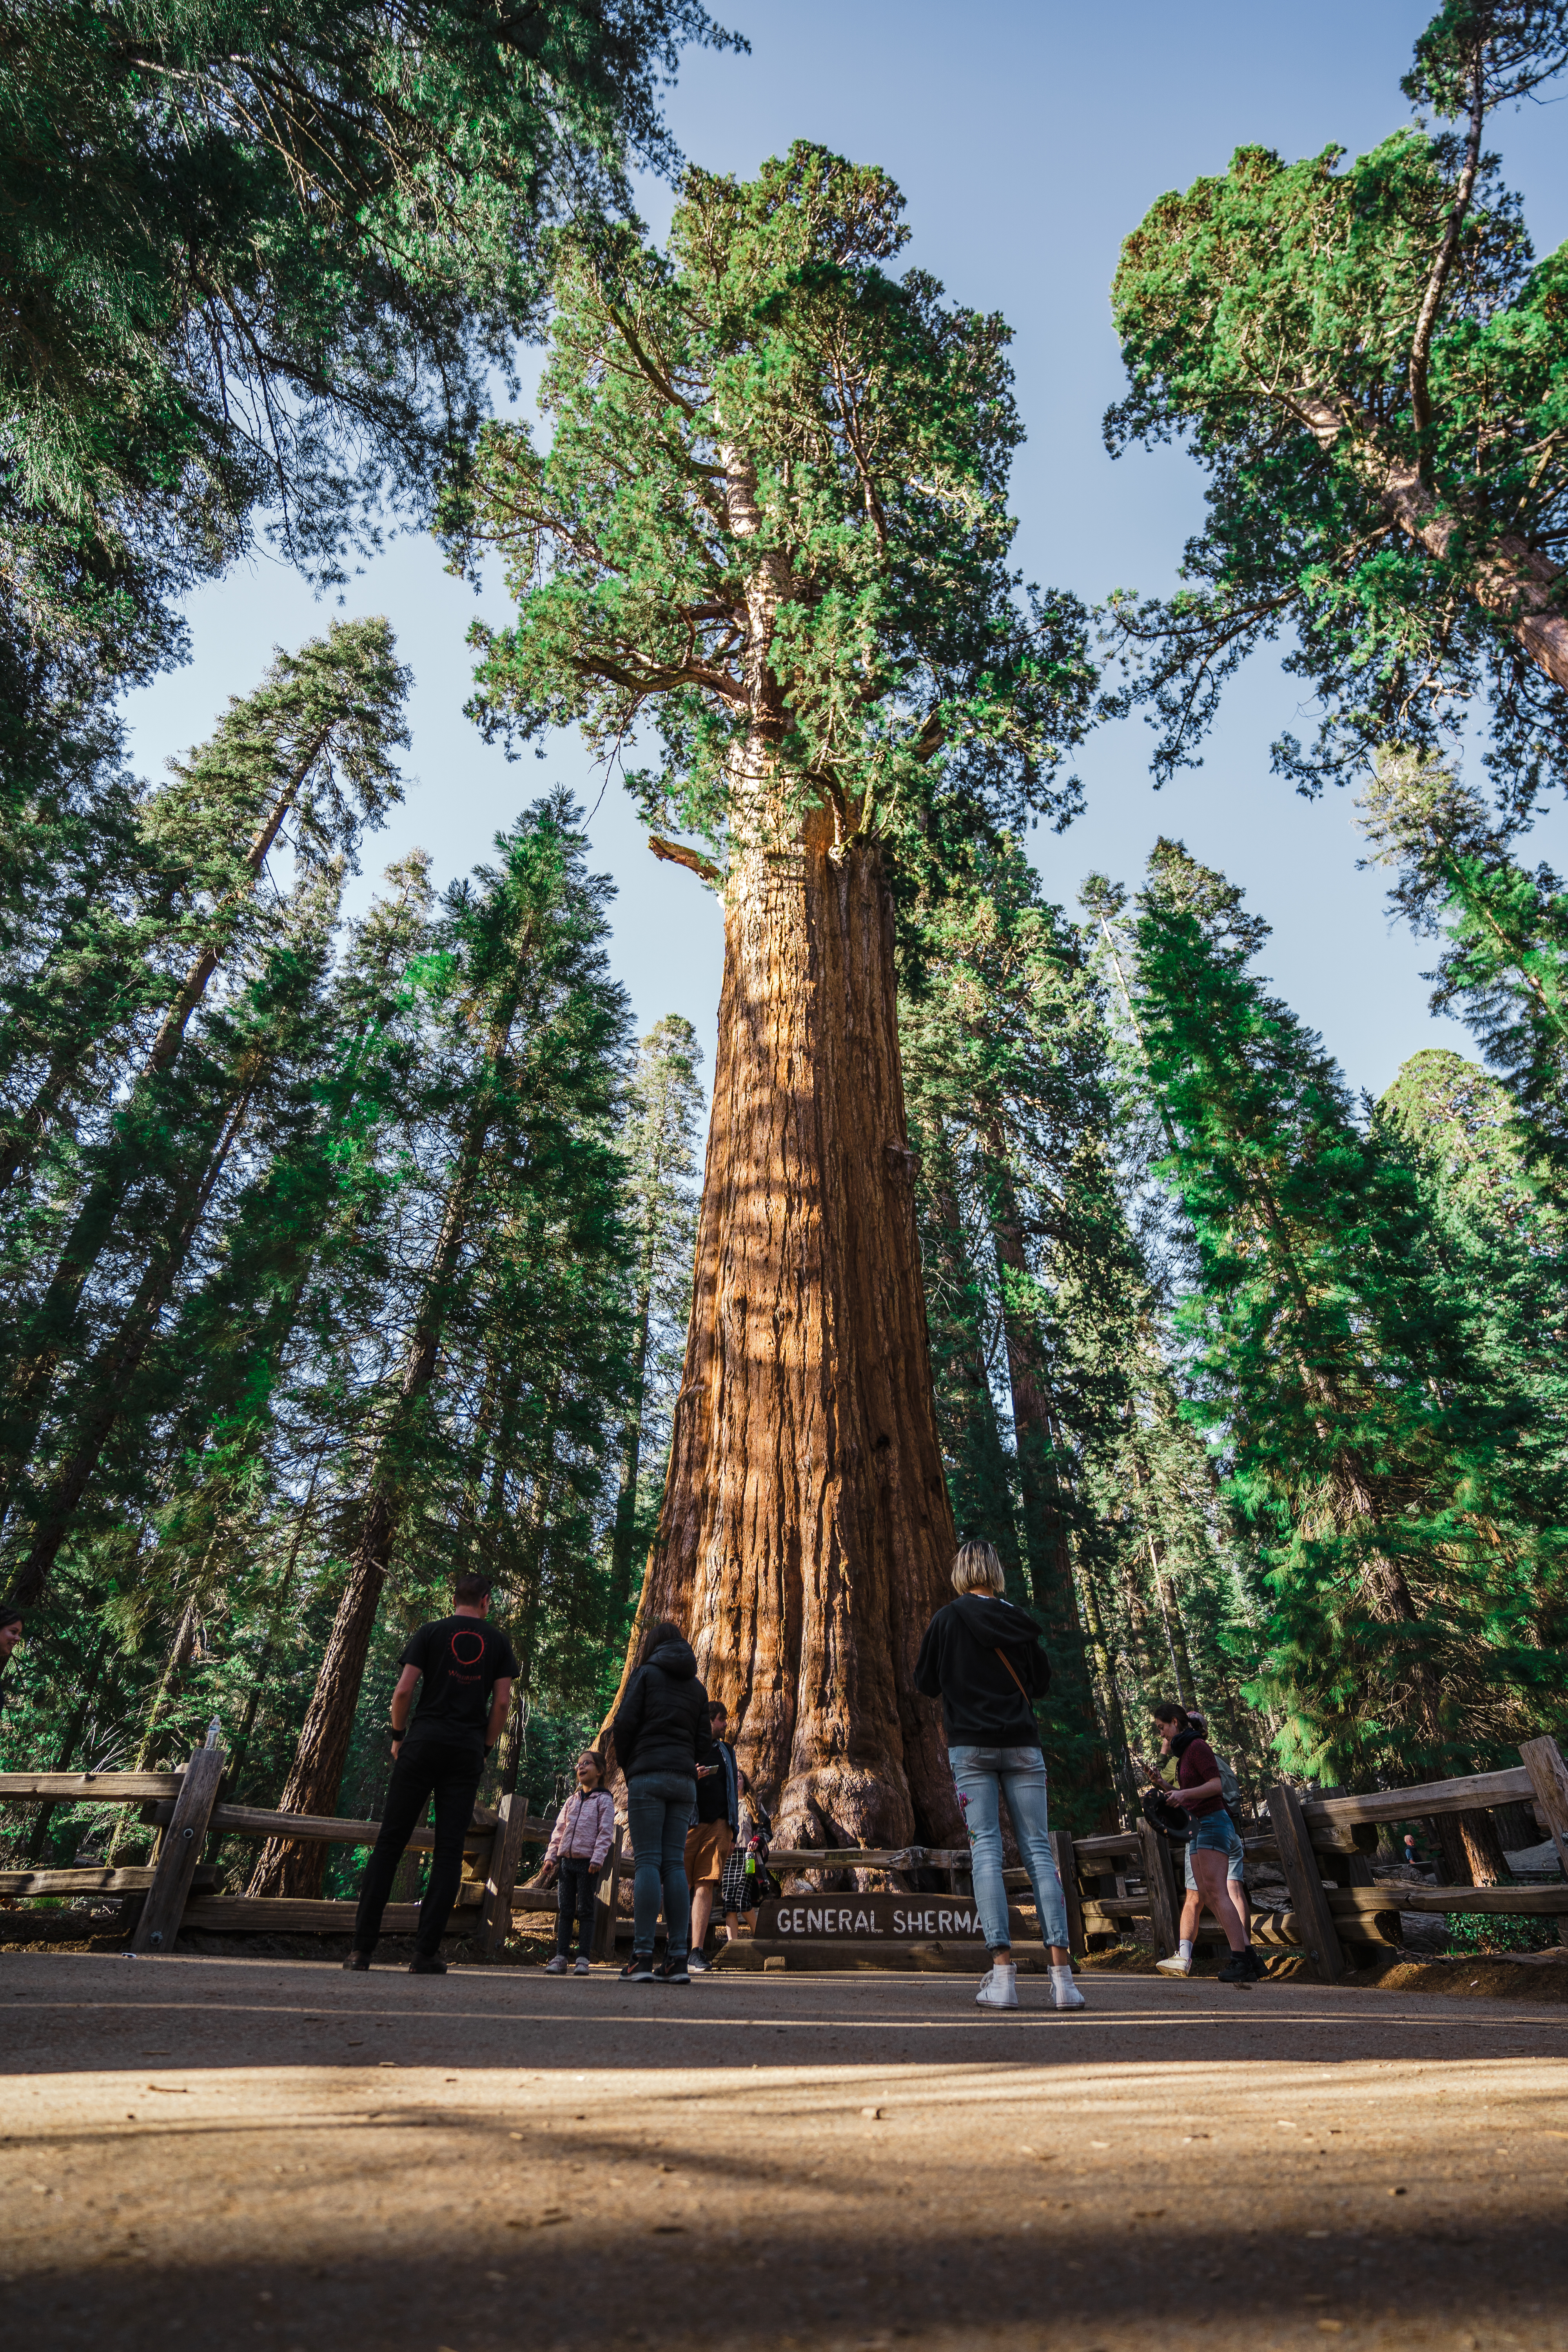
Until quite recently I had imagined that a tree was just a tree. Then Jean and I got to watch a YouTube video on trees and it blew our minds. Here is what we watched:
That led us on to watching Judi Dench’s video of trees:
Which is a longish introduction to a piece on The Conversation about trees.
ooOOoo
Trees don’t like to breathe wildfire smoke, either – and they’ll hold their breath to avoid it
When wildfire smoke is in the air, doctors urge people to stay indoors to avoid breathing in harmful particles and gases. But what happens to trees and other plants that can’t escape from the smoke?
They respond a bit like us, it turns out: Some trees essentially shut their windows and doors and hold their breath.
As atmospheric and chemical scientists, we study the air quality and ecological effects of wildfire smoke and other pollutants. In a study that started quite by accident when smoke overwhelmed our research site in Colorado, we were able to watch in real time how the leaves of living pine trees responded.
How plants breathe
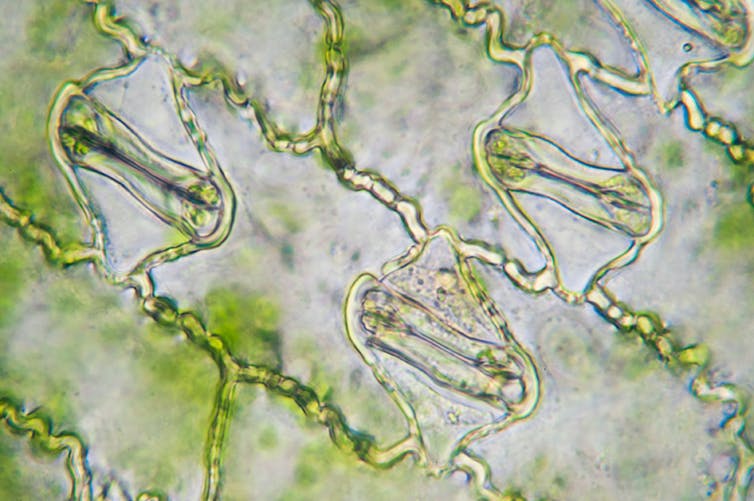
Plants have pores on the surface of their leaves called stomata. These pores are much like our mouths, except that while we inhale oxygen and exhale carbon dioxide, plants inhale carbon dioxide and exhale oxygen.
Both humans and plants inhale other chemicals in the air around them and exhale chemicals produced inside them – coffee breath for some people, pine scents for some trees.
Unlike humans, however, leaves breathe in and out at the same time, constantly taking in and releasing atmospheric gases.
Clues from over a century of research
In the early 1900s, scientists studying trees in heavily polluted areas discovered that those chronically exposed to pollution from coal-burning had black granules clogging the leaf pores through which plants breathe. They suspected that the substance in these granules was partly created by the trees, but due to the lack of available instruments at the time, the chemistry of those granules was never explored, nor were the effects on the plants’ photosynthesis.
For example, a study of multiple crop and wetland sites in California showed that smoke scatters light in a way that made plants more efficient at photosynthesis and growth. However, a lab study in which plants were exposed to artificial smoke found that plant productivity dropped during and after smoke exposure – though those plants did recover after a few hours.
There are other clues that wildfire smoke can impact plants in negative ways. You may have even tasted one: When grapes are exposed to smoke, their wine can be tainted.
What makes smoke toxic, even far from the fire
When wildfire smoke travels long distances, the smoke cooks in sunlight and chemically changes.
Mixing volatile organic compounds, nitrogen oxides and sunlight will make ground-level ozone, which can cause breathing problems in humans. It can also damage plants by degrading the leaf surface, oxidizing plant tissue and slowing photosynthesis.
While scientists usually think about urban regions as being large sources of ozone that effect crops downwind, wildfire smoke is an emerging concern. Other compounds, including nitrogen oxides, can also harm plants and reduce photosynthesis.
Taken together, studies suggest that wildfire smoke interacts with plants, but in poorly understood ways. This lack of research is driven by the fact that studying smoke effects on the leaves of living plants in the wild is hard: Wildfires are hard to predict, and it can be unsafe to be in smoky conditions.
Accidental research – in the middle of a wildfire
We didn’t set out to study plant responses to wildfire smoke. Instead, we were trying to understand how plants emit volatile organic compounds – the chemicals that make forests smell like a forest, but also impact air quality and can even change clouds.
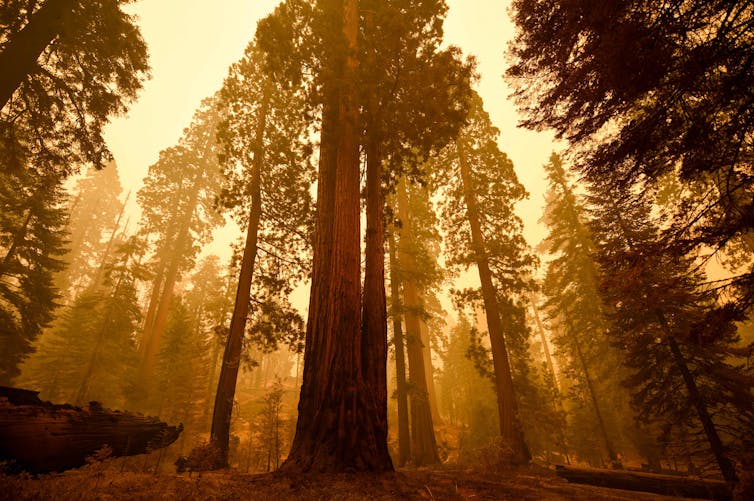
Fall 2020 was a bad season for wildfires in the western U.S., and thick smoke came through a field site where we were working in the Rocky Mountains of Colorado.
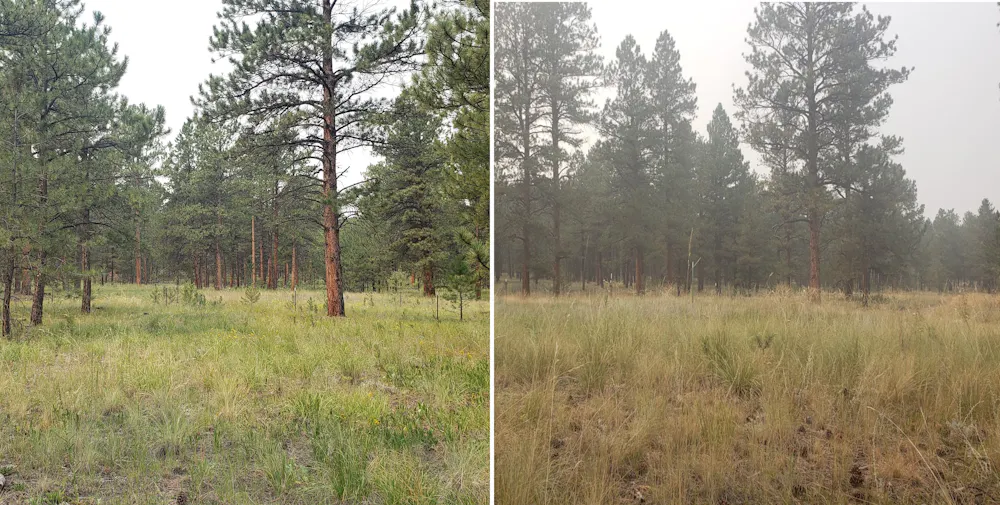
On the first morning of heavy smoke, we did our usual test to measure leaf-level photosynthesis of Ponderosa pines. We were surprised to discover that the tree’s pores were completely closed and photosynthesis was nearly zero.
We also measured the leaves’ emissions of their usual volatile organic compounds and found very low readings. This meant that the leaves weren’t “breathing” – they weren’t inhaling the carbon dioxide they need to grow and weren’t exhaling the chemicals they usually release.
A clear day at the Colorado test site, on the left, compared to the smoky day when trees responded to the poor air quality, on the right. Mj Riches, CC BY-SA
With these unexpected results, we decided to try to force photosynthesis and see if we could “defibrillate” the leaf into its normal rhythm. By changing the leaf’s temperature and humidity, we cleared the leaf’s “airways” and saw a sudden improvement in photosynthesis and a burst of volatile organic compounds.
What our months of data told us is that some plants respond to heavy bouts of wildfire smoke by shutting down their exchange with outside air. They are effectively holding their breath, but not before they have been exposed to the smoke.
We hypothesize a few processes that could have caused leaves to close their pores: Smoke particles could coat the leaves, creating a layer that prevents the pores from opening. Smoke could also enter the leaves and clog their pores, keeping them sticky. Or the leaves could physically respond to the first signs of smoke and close their pores before they get the worst of it.
It’s likely a combination of these and other responses.
The long-term impact is still unknown
The jury is still out on exactly how long the effects of wildfire smoke last and how repeated smoke events will affect plants – including trees and crops – over the long term.
That’s the fire in California that is growing so quickly!
There are so many stories around about these dogs being rescued. I have chosen the YouTube video which is the CBS News, Chicago, presentation.
A homeowner was forced to leave their truck behind with the adult rottweiler and her puppies. The owner told rescuers where they were, but the intense fire blocked access to the truck. Several days later, rescuers spotted the dogs from a helicopter and landed to get them.







 Learning from Dogs