The winter solstice, also called the hiemal solstice, hibernal solstice, and brumal solstice, occurs when either of Earth‘s poles reaches its maximum tilt away from the Sun. This happens twice yearly, once in each hemisphere (Northern and Southern). For that hemisphere, the winter solstice is the day with the shortest period of daylight and longest night of the year, when the Sun is at its lowest daily maximum elevation in the sky. Either pole experiences continuous darkness or twilight around its winter solstice. The opposite event is the summer solstice. Depending on the hemisphere’s winter solstice, at the Tropic of Cancer or Capricorn, the Sun reaches 90° below the observer’s horizon at solar midnight, to the nadir.
The winter solstice occurs during the hemisphere’s winter. In the Northern Hemisphere, this is the December solstice (usually December 21 or 22) and in the Southern Hemisphere, this is the June solstice (usually June 20 or 21). Although the winter solstice itself lasts only a moment, the term sometimes refers to the day on which it occurs. Other names are the “extreme of winter” (Dongzhi), or the “shortest day”. Since the 18th century, the term “midwinter” has sometimes been used synonymously with the winter solstice, although it carries other meanings as well. Traditionally, in many temperate regions, the winter solstice is seen as the middle of winter, but today in some countries and calendars, it is seen as the beginning of winter.
Since prehistory, the winter solstice has been seen as a significant time of year in many cultures, and has been marked by festivals and rituals. It marked the symbolic death and rebirth of the Sun. The seasonal significance of the winter solstice is in the reversal of the gradual lengthening of nights and shortening of days.
Later on, that article speaks of the Celtic history:
Celtic
Prior to the arrival of Christianity, the Celtic people of Britain celebrated Yule in a similar fashion to the Germanic festival. It is alleged that Celtic Druids began the tradition of the Yule Log, with the intention of driving out darkness, evil spirits, and poor luck in the following year. The Yule Log was intended to be kept alight over the entire solstice period, twelve days over which the sun was believed to stand still. The log being extinguished symbolised poor luck in the following year. Additionally, evergreen plants were used in decoration – of key significance are “The Holly and the Ivy”, used in decoration, and Mistletoe, suspended over a doorway in a token gesture of goodwill to all who passed under it. These traditions have been adopted into the Christian winter celebrations, symbolised by a mistletoe wreath placed on the front door to a building.
It is a most ancient celebration because as soon as humans recognised that this was the shortest day they were deeply respectful of the forces of the universe.
The point at which the sun reaches its farthest point north of the equator is the Summer Solstice, well it is for the Northern Hemisphere. This occurs annually on June 20 or June 21, depending on your time zone.
Here in Southern Oregon, the moment of the Summer Solstice will be at 2:43 PM or 14:43 PDT on Saturday, i.e. today! For the United Kingdom it will be at 22:43 BST on the same day or 21:43 GMT/UTC.
A quick web ‘look-up’ finds that the word solstice is from the Latin solstitium, from sol (sun) and stitium (to stop), reflecting the fact that the Sun appears to stop at this time, albeit momentarily.
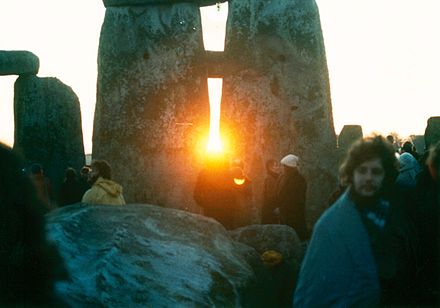
At the ancient stone circle of Stonehenge in Southern England, the prehistoric monument that took Neolithic builders an estimated 1,500 years to erect, for many years the Druids have celebrated the Solstice and, undoubtedly, will be doing so again.
AMESBURY, UNITED KINGDOM – JUNE 21: A man stands on top of Stonehenge as the sun rises over Salisbury Plain on June 21, 2006 in Amesbury, England. Police estimated around 17,000 people travelled to watch the sun rise over the 5,000 year old stone circle to start the longest day of the year. (Photo by Daniel Berehulak/Getty Images)
There’s a good article over at EarthSky on this year’s Solstice. I would like to quote a little from it:
At the June solstice, Earth is positioned in its orbit so that our world’s North Pole is leaning most toward the sun. As seen from Earth, the sun is directly overhead at noon 23 1/2 degrees north of the equator, at an imaginary line encircling the globe known as the Tropic of Cancer – named after the constellation Cancer the Crab. This is as far north as the sun ever gets.
All locations north of the equator have days longer than 12 hours at the June solstice. Meanwhile, all locations south of the equator have days shorter than 12 hours.
and
Where should I look to see signs of the solstice in nature? Everywhere. For all of Earth’s creatures, nothing is so fundamental as the length of the day. After all, the sun is the ultimate source of almost all light and warmth on Earth’s surface.
If you live in the Northern Hemisphere, you might notice the early dawns and late sunsets, and the high arc of the sun across the sky each day. You might see how high the sun appears in the sky at local noon. And be sure to look at your noontime shadow. Around the time of the solstice, it’s your shortest noontime shadow of the year.
If you’re a person who’s tuned in to the out-of-doors, you know the peaceful, comforting feeling that accompanies these signs and signals of the year’s longest day.
Is the solstice the first day of summer? No world body has designated an official day to start each new season, and different schools of thought or traditions define the seasons in different ways.
In meteorology, for example, summer begins on June 1. And every schoolchild knows that summer starts when the last school bell of the year rings.
Yet June 21 is perhaps the most widely recognized day upon which summer begins in the Northern Hemisphere and upon which winter begins on the southern half of Earth’s globe. There’s nothing official about it, but it’s such a long-held tradition that we all recognize it to be so.
It has been universal among humans to treasure this time of warmth and light.
For us in the modern world, the solstice is a time to recall the reverence and understanding that early people had for the sky. Some 5,000 years ago, people placed huge stones in a circle on a broad plain in what’s now England and aligned them with the June solstice sunrise.
We may never comprehend the full significance of Stonehenge. But we do know that knowledge of this sort wasn’t limited to just one part of the world. Around the same time Stonehenge was being constructed in England, two great pyramids and then the Sphinx were built on Egyptian sands. If you stood at the Sphinx on the summer solstice and gazed toward the two pyramids, you’d see the sun set exactly between them.
How does it end up hotter later in the summer, if June has the longest day? People often ask:
If the June solstice brings the longest day, why do we experience the hottest weather in late July and August?
This effect is called the lag of the seasons. It’s the same reason it’s hotter in mid-afternoon than at noontime. Earth just takes a while to warm up after a long winter. Even in June, ice and snow still blanket the ground in some places. The sun has to melt the ice – and warm the oceans – and then we feel the most sweltering summer heat.
Ice and snow have been melting since spring began. Meltwater and rainwater have been percolating down through snow on tops of glaciers.
But the runoff from glaciers isn’t as great now as it’ll be in another month, even though sunlight is striking the northern hemisphere most directly around now.
So wait another month for the hottest weather. It’ll come when the days are already beginning to shorten again, as Earth continues to move in orbit around the sun, bringing us closer to another winter.
And so the cycle continues.
Indeed, so the cycle continues as it has for time immemorial!
Posted by Deborah Byrd in Astronomy Essentials | Earth|December 15, 2019
December solstice 2019 arrives on December 22 at 4:19 UTC.
That’s December 21 for much of North America. High summer for the Southern Hemisphere. For the Northern Hemisphere, the return of more sunlight!
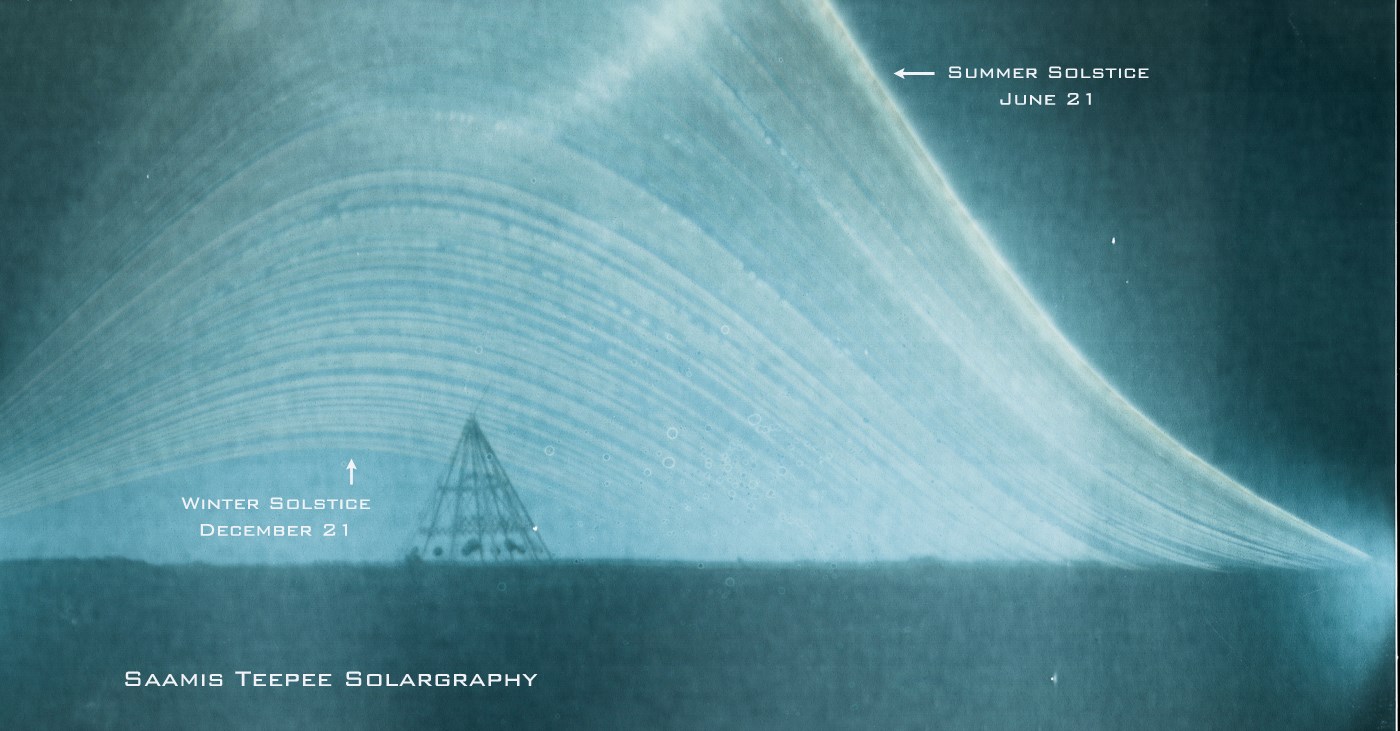
Ian Hennes in Medicine Hat, Alberta, Canada, created this solargraph between a June solstice and a December solstice. It shows the path of the sun during that time period.
Late dawn. Early sunset. Short day. Long night. For us in the Northern Hemisphere, the December solstice marks the longest night and shortest day of the year. Meanwhile, on the day of the December solstice, the Southern Hemisphere has its longest day and shortest night. The 2019 December solstice takes place on Sunday, December 22, at 04:19 UTC (That’s December 21 at 10:19 p.m. CST; translate UTC to your time).
No matter where you live on Earth’s globe, a solstice is your signal to celebrate.
When is the solstice? The solstice happens at the same instant for all of us, everywhere on Earth. In 2019, the December solstice comes on December 21 at 10:19 p.m. CST. That’s on December 22 at 04:19 Universal Time (UTC). It’s when the sun on our sky’s dome reaches its farthest southward point for the year. At this solstice, the Northern Hemisphere has its shortest day and longest night of the year.
Just remember: you’re translating from 04:19 UT on December 22. For example, if you live in Perth, Australia, you need to add 8 hours to Universal Time to find out that the solstice happens on Sunday, December 22, at 12:19 p.m. AWST (Australian Western Standard Time).
Day and night sides of Earth at the instant of the December 2019 solstice (December 22, 2019, at 04:19 UTC). Image via EarthView.
What is a solstice? The earliest people on Earth knew that the sun’s path across the sky, the length of daylight, and the location of the sunrise and sunset all shifted in a regular way throughout the year. They built monuments such as Stonehenge in England – or, for example, at Machu Picchu in Peru – to follow the sun’s yearly progress.
But we today see the solstice differently. We can picture it from the vantage point of space. Today, we know that the solstice is an astronomical event, caused by Earth’s tilt on its axis and its motion in orbit around the sun.
Because Earth doesn’t orbit upright, but is instead tilted on its axis by 23 1/2 degrees, Earth’s Northern and Southern Hemispheres trade places in receiving the sun’s light and warmth most directly. The tilt of the Earth – not our distance from the sun – is what causes winter and summer. At the December solstice, the Northern Hemisphere is leaning most away from the sun for the year.
At the December solstice, Earth is positioned in its orbit so that the sun stays below the North Pole horizon. As seen from 23 1/2 degrees south of the equator, at the imaginary line encircling the globe known as the Tropic of Capricorn, the sun shines directly overhead at noon. This is as far south as the sun ever gets. All locations south of the equator have day lengths greater than 12 hours at the December solstice. Meanwhile, all locations north of the equator have day lengths less than 12 hours.
For us on the northern part of Earth, the shortest day comes at the solstice. After the winter solstice, the days get longer, and the nights shorter. It’s a seasonal shift that nearly everyone notices.
Earth has seasons because our world is tilted on its axis with respect to our orbit around the sun. Image via NASA.
Where should I look to see signs of the solstice in nature? Everywhere.
For all of Earth’s creatures, nothing is so fundamental as the length of daylight. After all, the sun is the ultimate source of all light and warmth on Earth.
If you live in the Northern Hemisphere, you can notice the late dawns and early sunsets, and the low arc of the sun across the sky each day. You might notice how low the sun appears in the sky at local noon. And be sure to look at your noontime shadow. Around the time of the December solstice, it’s your longest noontime shadow of the year.
In the Southern Hemisphere, it’s opposite. Dawn comes early, and dusk comes late. The sun is high. It’s your shortest noontime shadow of the year.
Around the time of the winter solstice, watch for late dawns, early sunsets, and the low arc of the sun across the sky each day. Notice your noontime shadow, the longest of the year. Photo via Serge Arsenie on Flickr.
Meanwhile, at the summer solstice, noontime shadows are short. Photo via the Slam Summer Beach Volleyball festival in Australia.
Why doesn’t the earliest sunset come on the shortest day? The December solstice marks the shortest day of the year in the Northern Hemisphere and longest day in the Southern Hemisphere. But the earliest sunset – or earliest sunrise if you’re south of the equator – happens before the December solstice. Many people notice this, and ask about it.
The key to understanding the earliest sunset is not to focus on the time of sunset or sunrise. The key is to focus on what is called true solar noon – the time of day that the sun reaches its highest point in its journey across your sky.
In early December, true solar noon comes nearly 10 minutes earlier by the clock than it does at the solstice around December 22. With true noon coming later on the solstice, so will the sunrise and sunset times.
It’s this discrepancy between clock time and sun time that causes the Northern Hemisphere’s earliest sunset and the Southern Hemisphere’s earliest sunrise to precede the December solstice.
The discrepancy occurs primarily because of the tilt of the Earth’s axis. A secondary but another contributing factor to this discrepancy between clock noon and sun noon comes from the Earth’s elliptical – oblong – orbit around the sun. The Earth’s orbit is not a perfect circle, and when we’re closest to the sun, our world moves fastest in orbit. Our closest point to the sun – or perihelion – comes in early January. So we are moving fastest in orbit around now, slightly faster than our average speed of about 18.5 miles per second (30 kilometers per second). The discrepancy between sun time and clock time is greater around the December solstice than the June solstice because we’re nearer the sun at this time of year.
Solstice sunsets, showing the sun’s position on the local horizon at December 2015 (left) and June 2016 (right) solstices from Mutare, Zimbabwe, via Peter Lowenstein.
The precise date of the earliest sunset depends on your latitude. At mid-northern latitudes, it comes in early December each year. At northern temperate latitudes farther north – such as in Canada and Alaska – the year’s earliest sunset comes around mid-December. Close to the Arctic Circle, the earliest sunset and the December solstice occur on or near the same day.
By the way, the latest sunrise doesn’t come on the solstice either. From mid-northern latitudes, the latest sunrise comes in early January.
The exact dates vary, but the sequence is always the same: earliest sunset in early December, shortest day on the solstice around December 22, latest sunrise in early January.
And so the cycle continues.
Solstice Pyrotechnics II by groovehouse on Flickr.
Bottom line: The 2019 December solstice takes place on Sunday, December 22, at 04:19 UTC (that’s December 21 at 10:19 p.m. CST; translate UTC to your time). It marks the Northern Hemisphere’s shortest day (first day of winter) and Southern Hemisphere’s longest day (first day of summer). Happy solstice, everyone!
ooOOoo
Well for many in the Northern Hemisphere the worst of the winter weather is yet to come.
The point at which the sun reaches its farthest point north of the equator is the Summer Solstice, well it is for the Northern Hemisphere. This occurs annually on June 20 or June 21, depending on your time zone.
Here in Southern Oregon, the moment of the Summer Solstice will be 22:04 Pacific Daylight Time (PDT) on the evening of June 20th and at 05:04 GMT/UTC on June 21 2013 in the United Kingdom.
A quick web ‘look-up’ finds that the word solstice is from the Latin solstitium, from sol (sun) and stitium (to stop), reflecting the fact that the Sun appears to stop at this time, albeit momentarily.
At the ancient stone circle of Stonehenge in Southern England, the prehistoric monument that took Neolithic builders an estimated 1,500 years to erect, for many years the Druids have celebrated the Solstice and, undoubtedly, will be doing so again.
AMESBURY, UNITED KINGDOM – JUNE 21: A man stands on top of Stonehenge as the sun rises over Salisbury Plain on June 21, 2006 in Amesbury, England. Police estimated around 17,000 people travelled to watch the sun rise over the 5,000 year old stone circle to start the longest day of the year. (Photo by Daniel Berehulak/Getty Images)
Recent news items reinforce messages from yesterday’s book review.
In my review published yesterday of Martin Lack’s book Denial of Science, I wrote, “the continuing and accelerating loss of the Arctic ice-cap“. Back on the 22nd in More new tomorrows, I included:
A study published in 2012 showed that by changing the temperature balance between the Arctic and mid-latitudes, rapid Arctic warming is altering the course of the jet stream, which steers weather systems from west to east around the northern hemisphere. The Arctic has been warming about twice as fast as the rest of the Northern Hemisphere, due to a combination of human emissions of greenhouse gases and unique feedbacks built into the Arctic climate system. The jet stream, the study said, is becoming “wavier,” with steeper troughs and higher ridges.
A new study published in the journal Environmental Research Letters shows that reduced sea ice cover can favor colder and stormier winters in the northern midlatitudes. [my emphasis – UK readers will need no reminding of this!]
So bear those references in mind as you read:
Breaking News (Literally): NOAA Video Confirms Early Breakup
A series of intense storms in the Arctic has caused fracturing of the sea ice around the Beaufort Sea along the northern coasts of Alaska and Canada. High-resolution imagery from the Suomi NPP satellite shows the evolution of the cracks forming in the ice, called leads, from February 17 — March 18 2013. The general circulation of the area is seen moving the ice westward along the Alaskan coast
“Intense storms” are not an unheard of thing in the arctic. What’s new is that the ice is so fragile that normal storm activity is breaking it up much earlier than has been seen in the past.
To recapitulate: It is normal for the ice to crack and for leads to occur. However, this is very extensive cracking and there are some very big leads, and all of it seems to come earlier than expected. Given last year’s melting mayhem and the low amount of multi-year ice, it makes one wonder whether this early cracking will have any effect in the melting season to come.
There are still several weeks to go before this part of the Arctic is going to start melting, up till then the ice will actually thicken some more, even when the Sun’s rays start to reach the ice. But the ice is already getting broken up in smaller pieces, which means that 1) the pack becomes more mobile (like we saw last year), and 2) the thin ice that now grows to fill up the leads will go first when the melting starts, potentially leading to more open water between floes to absorb solar energy and convert it to heat.
But maybe not. Maybe this will have zero influence. We don’t know. That’s why we watch.
Nothing more to add except to ponder on what strange weather we will be experiencing this year! Actually, no need to ponder. The UK Met Office issued a weather warning last Sunday that included this sentence, “Cold easterly winds will persist through the coming week with bitterly cold conditions.” That came on the back of a blog entry from the Met Office that same day that included:
Many areas also saw strong winds, with a gust of 61 mph recorded at Shap, Cumbria and 48 mph recorded at Machrihanish, Argyll . These winds have caused even deeper drifts of snow in some areas. [my emphasis].
61mph? That’s Storm Force 10 under the Beaufort scale and 3mph under the lower boundary of a Violent Storm; Beaufort Force 11!
oooOOOooo
The next item that caught my eye was some ‘goodish’ news from the US Senate via a recent post on 350.org.
After a very chaotic week on Capitol Hill, I wanted to write you with an update on what just happened in the Senate today.
First and foremost: the oil industry’s Senators did not manage to pass legislation that would force President Obama to build Keystone XL.
Because you — and people like you, all across the country — jumped into action this week, they backtracked and instead held a vote on a nonbinding resolution that says it would be nice to build the pipeline, but doesn’t actually do much about it. For that vote, they got the stomach-churning number of 62 Senators to vote with them. As usual, the ones who had taken the most money from the fossil fuel industry lined up to cast their votes—the cosponsors of the bill, on average, had taken $807,000 in dirty energy money.
Now, this amounts to symbolic chest thumping by the oil industry: showing just how many Senators they can get to jump when told to. It’s not the worst thing that could have happened, but it reminds everyone why, in one recent poll, congress had approval ratings lower than head lice and colonoscopies — even on the symbolic stuff, they can’t get it together to stand up to the oil industry guys cutting them checks.
In a certain way though, this vote couldn’t come at a better time. Congress is going on break, and for the next two weeks, these 62 Senators will be back in their home states, doing things like meeting with constituents — people like you.
Home states are where some of the most heroic work took place the last week — in Minneapolis, say, where 150 350MN.org activists showed up on very short notice at Sen. Klobuchar’s office in a snowstorm to tell her to vote no on Keystone (and she did, it should be added).
If you’re interested in following in the fine example of those leaders who held actions at their senators offices, you have a chance in the next two weeks.
We’re looking for people who can step up to lead, and then we’ll put the 350 network into action to get people to join you. If you want to lead an action, just click here to tell us when you’d like to do so: act.350.org/survey/kxl-senate-accountability-2013/
Look, there are two ways to react to a democracy for sale. One is to walk away in disgust, which is what the Koch Brothers count on. The other is to stand up and say: no more. If you visit your Senator, take some pictures or some video so we can share them around. It’s time to build this broader fossil fuel resistance.
And remember, Capitol Hill is not the center of the world. Around the country this week our friends at Tar Sands Blockade have been actively targeting Keystone investors; faith groups have been hauled off to jail in front of the White House to protest the pipeline; and the divestment campaign has expanded off college campuses and into municipal and state governments.
The movement is doing amazing stuff — we just need more of it. We can’t outspend the oil industry, but we can out-organize them. In fact, we have to.
Forward,
Bill McKibben
oooOOOooo
“the cosponsors of the bill, on average, had taken $807,000 in dirty energy money.” Words utterly fail me!
We spent some enjoyable time with neighbours Dordie and Bill yesterday afternoon from where my sub-heading quote comes. Perhaps, a tad tongue-in-cheek, but only a tad!
Yesterday, the bulk of my post The new tomorrows consisted of a powerful essay from William deBuys ‘Phoenix in the Climate Crosshairs‘, courtesy of TomDispatch. It painted in very stark terms the impact of climate change on the metropolitan city of Phoenix in Arizona; a city of over 4 million people, indeed home to more than two-thirds of Arizona’s population.
So, today, I wanted to wander through some other aspects of this new world order.
Here’s a recent item on Climate Crocks examining the changes in March’s weather, 2013 vs 2012. From which I quote:
Much Different March. Same Reason?
Dittohead reasoning: “So when it’s warm, you blame it on climate change. When its cold, you blame it on climate change. It can’t be both.”
I think we’ve passed the point of tolerance with these ceaseless storms. Gone are the days when viewers would flood our inboxes with pretty pictures of their pets and kids frolicing in the snow. Constant cleanup has made us snippy and short – even a few plow guys have hoisted the white flag. The holidays are long past, the winter is stale, and the people just want spring…
…and accountability. Instead of pictures, I get questions in my inbox. “Why are we getting so much snow? Why did it turn on a dime? And when will it stop?”
Those are fair questions. But with the limits of the long range (10-14 day) forecasts, I’m not ready to answer the last question. We may sail out of this in April, but so far the first week of the month isn’t looking much different from the first week in March. The ultimate question is why.
The jetstream has taken on an odd path. [my emphasis]
Now just look at this:
Forecast sea level pressure departures from average from the GFS computer model. This shows the large area of unusually high atmospheric pressure over Greenland. Image from Weatherbell
Later on that article says:
Recent research suggests that rapid Arctic climate change, namely the loss of sea ice cover, may be contributing to blocking patterns like we’re seeing right now. That rapid decline in Arctic sea ice since the beginning of the satellite record in 1979 may be altering weather patterns both in the Far North and across the U.S.. Some studies have shown that sea ice loss favors atmospheric blocking patterns such as the pattern currently in place, while others have not shown statistically significant changes in blocking patterns across the Northern Hemisphere, at least not yet. Arctic sea ice extent declined to a record low during the 2012 melt season.
The last Winter in North-West Europe has been ‘interesting’, to say the least! A follow-up to that Climate Crock’s essay reports:
A study published in 2012 showed that by changing the temperature balance between the Arctic and mid-latitudes, rapid Arctic warming is altering the course of the jet stream, which steers weather systems from west to east around the northern hemisphere. The Arctic has been warming about twice as fast as the rest of the Northern Hemisphere, due to a combination of human emissions of greenhouse gases and unique feedbacks built into the Arctic climate system. The jet stream, the study said, is becoming “wavier,” with steeper troughs and higher ridges.
A new study published in the journal Environmental Research Letters shows that reduced sea ice cover can favor colder and stormier winters in the northern midlatitudes
Did you fully take in that paragraph? The one about “The Arctic has been warming about twice as fast as the rest of the Northern Hemisphere …“?
The other great ‘river’ in the North Atlantic is the thermohaline circulation or to put it in more familiar terms: The Gulf Stream. Has that been changing? You bet! In more ways than one might expect.
Here’s a snippet from an item from last October’s issue of Nature journal:
Recent changes to the Gulf Stream causing widespread gas hydrate destabilization
The Gulf Stream is an ocean current that modulates climate in the Northern Hemisphere by transporting warm waters from the Gulf of Mexico into the North Atlantic and Arctic oceans. A changing Gulf Stream has the potential to thaw and convert hundreds of gigatonnes of frozen methane hydrate trapped below the sea floor into methane gas, increasing the risk of slope failure and methane release.
How the Gulf Stream changes with time and what effect these changes have on methane hydrate stability is unclear. Here, using seismic data combined with thermal models, we show that recent changes in intermediate-depth ocean temperature associated with the Gulf Stream are rapidly destabilizing methane hydrate along a broad swathe of the North American margin.
As the diagram below shows all too clearly, the cold waters from above the Arctic circle directly affect the Gulf Stream.
Average sea ice extent for February 2013 was 14.66 million square kilometers (5.66 million square miles). This is 980,000 square kilometers (378,000 square miles) below the 1979 to 2000 average for the month, and is the seventh-lowest February extent in the satellite record.
Less ice means more cold water. QED!
OK, moving on.
We met recently with Wayne over at Rogue Valley Firewood here in Merlin. Not to buy more firewood but because Wayne has started into hugelkultur. Jean and I hadn’t heard of the term before. Come back to that in a moment.
In musing with Wayne about how rapidly life is changing for us all, he spoke of the consequence of rising fuel prices and the rising costs of putting petrol (OK, he used the word ‘gas’!) in one’s car. Wayne pointed out the obvious. That the inevitable effect of those rising costs would be to steadily reduce one’s range for ‘affordable’ car journeys. Many people will no longer be able to afford to drive longer distances.
In other words, local will increasingly become more relevant to daily life. Or to use a better word than local, community will return to the centre stage of our world. And of all the things important to a community, none is more so than access to food.
Back to Hugelkultur. Watch this video:
Wayne is committed to seeing just what can be grown for the local community of Merlin using this form of raised garden bed. You can read more here.
The USDA’s new Food Access Research Atlas is a map of all the places in the country where people live in food deserts — places where it’s difficult to access fresh food.
The message that hits me from that map is the consequence for millions of people, especially those in rural areas or unable to afford a car, when it comes to getting hold of fresh food. Another reason why community food programs are going to be a feature of the new tomorrows.
Finally, take a look at a recent item on Paul Gilding’s blogsite.
Paul Gilding
Paul is an independent writer, advisor and advocate for action on climate change and sustainability. He recently published Victory at Hand for the Climate Movement?From which I offer:
There are signs the climate movement could be on the verge of a remarkable and surprising victory. If we read the current context correctly, and if the movement can adjust its strategy to capture the opportunity presented, it could usher in the fastest and most dramatic economic transformation in history. This would include the removal of the oil, coal and gas industries from the economy in just a few decades and their replacement with new industries and, for the most part, entirely new companies. It would be the greatest transfer of wealth and power between industries and countries the world has ever seen.
To understand this incredible potential we first have to step back and understand the unique structure of this social change movement, which may rank among the most influential in history. It is simplistic to characterise it as an alliance of grass roots organisations and activists pitched against a rich and well connected adversary. While that is part of the story, it is more accurately understood as an idea whose tentacles reach into every tier of government, the world’s largest companies and financial institutions, and throughout the academic and science communities.
Because of this, it is winning the battle from within: Its core arguments and ideas are clearly right; being endorsed by the world’s top science bodies and any significant organisation that has examined them.
Strikes me that in one very important way, we will be reverting to how our ancient hunter-gatherer ancestors lived. I mean reverting to living our lives as relatively small interdependent communities almost exclusively at the local level.
Guess what! Yet another aspect of learning from dogs. In the wild, dogs live in groups of about 50 animals with clear boundaries to their territory. Just like the ancestors of the domesticated dog and the wild dog: The grey wolf Canis Lupus.
A new angle on the famous ‘hear no evil, see no evil, speak no evil’ saying!
What climate change??
That new angle being ‘hear no climate change, see no climate change, speak no climate change!‘
So what has prompted this outburst from me? It started with me seeing a truly scary graph that was on Peter Sinclair’s Climate Crock blogsite on the 20th September. That was the graph that was published yesterday on Learning from Dogs under the post title of It’s not rocket science! If you didn’t see that graph yesterday, don’t read further on until you have looked at it.
Thus while today’s post could easily be interpreted as yet another blogpost from yet another writer about climate change, that is not the case. What I am doing is taking a quick trip across a few recently published items that really do make it utterly clear what is happening to the Earth’s biosphere, all in support of a very simple question to two gentlemen who are currently in the news; stay with me for all to become clear!
However, this is what caught my eye, (an interview between Dr. Francis and Peter Sinclair).
What she told me in a recent interview was that the sea ice record is not something that we just pay attention to in September – there will, in fact, be reverberations that will make fall and winter “very interesting” around the globe.
An unusually strong storm formed off the coast of Alaska on August 5 and tracked into the center of the Arctic Ocean, where it slowly dissipated over the next several days. The center of the storm was located in the middle of the Arctic Ocean.
On Wednesday, the National Snow and Ice Data Center concluded Arctic sea ice is at its lowest late-August level since records began, and the area covered by ice has continued to shrink in September. Since 1979, the 1.54 million square miles of ice is the smallest coverage on record at the North Pole, the report states.
With so many questions surrounding these latest findings, perhaps one of the most immediate is whether this melting of sea ice will affect the upcoming winter across the United States and Northern Hemisphere. Is it possible that a lack of Arctic sea ice could change weather patterns across the globe?
Four meteorologists spoke about these possibilities, and while they didn’t say dramatic weather shifts are imminent in the short-term, they did give some thoughts on what could happen.
One of the meteorologists was Dr. Jeff Masters, Director of Meteorology, Weather Underground. He wrote,
In my December 2011 blog post, I discuss research by Dr. Jennifer Francis of Rutgers University, who found that Arctic sea ice loss may significantly affect the upper-level atmospheric circulation, slowing its winds and increasing its tendency to make contorted high-amplitude loops. High-amplitude loops in the upper level wind pattern (and associated jet stream) increases the probability of persistent weather patterns in the Northern Hemisphere, potentially leading to extreme weather due to longer-duration cold spells, snow events, heat waves, flooding events, and drought conditions.
Several studies published in 2012 have linked Arctic sea ice loss to an increase in probability of severe winter weather in Western Europe, Eastern North America and Eastern Asia.
Then if one goes to that December 2011 blog post, one reads this,
“The question is not whether sea ice loss is affecting the large-scale atmospheric circulation…it’s how can it not?” That was the take-home message from Dr. Jennifer Francis of Rutgers University, in her talk “Does Arctic Amplification Fuel Extreme Weather in Mid-Latitudes?“, presented at last week’s American Geophysical Union meeting in San Francisco. Dr. Francis presented new research in review for publication, which shows that Arctic sea ice loss may significantly affect the upper-level atmospheric circulation, slowing its winds and increasing its tendency to make contorted high-amplitude loops. High-amplitude loops in the upper level wind pattern (and associated jet stream) increases the probability of persistent weather patterns in the Northern Hemisphere, potentially leading to extreme weather due to longer-duration cold spells, snow events, heat waves, flooding events, and drought conditions.
Arctic sea ice loss can slow down jet stream winds
Dr. Francis looked at surface and upper level data from 1948 – 2010, and discovered that the extra heat in the Arctic in fall and winter over the past decade had caused the Arctic atmosphere between the surface and 500 mb (about 18,000 feet or 5,600 meters) to expand. As a result, the difference in temperature between the Arctic (60 – 80°N) and the mid-latitudes (30 – 50°N) fell significantly. It is this difference in temperature that drives the powerful jet stream winds that control much of our weather. The speed of fall and winter west-to-east upper-level winds at 500 mb circling the North Pole decreased by 20% over the past decade, compared to the period 1948 – 2000, in response to the extra warmth in the Arctic. This slow-down of the upper-level winds circling the pole has been linked to a Hot Arctic-Cold Continents pattern that brought cold, snowy winters to the Eastern U.S. and Western Europe during 2009 – 2010 and 2010 – 2011.
OK, nearly finished! Stay with me for one last item. Did you note in that blog post (the first section quoted) this, “Dr. Francis presented new research in review for publication …“? Here’s the Abstract from that publication, from which one reads,
Evidence linking Arctic amplification to extreme weather in mid-latitudes
Key Points
Enhanced Arctic warming reduces poleward temperature gradient
Weaker gradient affects waves in upper-level flow in two observable ways
Both effects slow weather patterns, favoring extreme weather
Jennifer A. Francis, Institute of Marine and Coastal Sciences, Rutgers University, New Brunswick, New Jersey, USA
Stephen J. Vavrus, Center for Climatic Research, University of Wisconsin-Madison, Madison, Wisconsin, USA
So to the point of both yesterday’s Post and the information above.
Will someone tell me why Messrs Barack Obama and Willard Mitt Romney so fervently adopt the stance of ‘hear no climate change, see no climate change, speak no climate change!‘
Raise your eyes in wonder at the most wonderful annual show from space.
A Perseid meteor streaks across the sky in this Aug. 12, 2008 photo near Rogers Spring in the Lake Mead National Recreation Area in Nevada. (Ethan Miller/Getty Images)
As of August 8, 2012, the zenithal hourly rate (ZHR) of meteors visible in a dark sky has gone up to 21! That’s according to the International Meteor Organization. Clearly the Perseid meteor shower is rising to its peak, as it does every year at this time.
The peak mornings will be August 11, 12 and 13. August 12 might be the best morning. August 11 might be better than August 13. The moon is waning now. And many people are seeing meteors!
The Delta Aquarid and Perseid meteor showers combine in late July and August to create what most consider the best and most reliable meteor display for Northern Hemisphere observers. As always, after midnight is the best time for meteor-watching. The moon will be there, but getting thinner every morning. On the mornings (not the evenings) of August 11, 12 and 13, the moon will be a waning crescent, and the meteors should be flying at a rate closer to their peak of 50 or 60 meteors per hour. As an added treat – on August 11, 12 and 13 – the moon will be sweeping past the brightest planets Venus and Jupiter in the eastern predawn sky. You can’t ask for more!
Well you could ask for more and there is more on that very helpful website, ergo:
August 10/11, 11/12, and 12/13, 2012 Perseids
Meteors are typically best after midnight, but in 2012, with the moon rising into the predawn sky, you might want to watch for Perseid meteors in late evening as well. You can get moonrise times via this custom sunset calendar. As seen from around the world, the waning crescent moon will rise later on August 12 than on August 11, and, on the morning of August 13, although you’re slightly past the peak, the moon will rise later still.
On any of those mornings, moonlight shouldn’t be so overwhelming as to ruin the show. Plus the moon on those mornings will be near the bright planets Venus and Jupiter in the eastern predawn sky. It’ll be a beautiful early morning scene.
The Perseids are typically fast and bright meteors. They radiate from a point in the constellation Perseus the Hero. You don’t need to know Perseus to watch the shower because the meteors appear in all parts of the sky. The Perseids are considered by many people to be the year’s best shower, and often peak at 50 or more meteors per hour in a dark sky.
The Perseids tend to strengthen in number as late night deepens into midnight, and typically produce the most meteors in the wee hours before dawn. These meteors are often bright and frequently leave persistent trains.
Starting in late evening on the nights of August 10/11, 11/12 and 12/13, the Perseid meteors will streak across these short summer nights from late night until dawn, with only a little interference from the waning crescent moon. Plus the moon will be near the bright planets Venus and Jupiter in the eastern predawn sky.
Finally, here’s some fabulously helpful information on the NASA website:
NASA Chat: Stay ‘Up All Night’ to Watch the Perseids!
Escape the heat of the waning days of summer for an evening of sky watching. The Perseid meteor shower peaks on the night of August 11 through the morning of August 12. Perseid rates can get as high as 100 per hour, with many fireballs visible in the night sky. A waning crescent moon will interfere slightly with this year’s show, but viewing should definitely be worth a look!
On the night of Aug. 11-12, astronomer Bill Cooke and his team from the Meteoroid Environment Office at NASA’s Marshall Space Flight Center will answer your questions about the 2012 Perseid meteor shower via an “Up All Night” live chat. To join the chat, simply return to this page and log in. The chat experts will be available to answer questions between the hours of 11 p.m. – 3 a.m. EDT, beginning the evening of Aug. 11 and continuing into the morning of Aug. 12.
Watch the Perseids! Live Video/Audio Feed
On the night of Aug. 11, a live video/audio feed of the Perseid shower will be embedded below (go to here). The camera is mounted at NASA’s Marshall Space Flight Center in Huntsville, Ala. During daylight, you’ll see a dark gray box — the camera is light-activated and will turn on at dusk. At night you’ll see white points, or stars, on a black background.
About the Perseids
The Perseids have been observed for at least 2,000 years and are associated with the comet Swift-Tuttle, which orbits the sun once every 133 years. Each year in August, the Earth passes through a cloud of the comet’s debris. These bits of ice and dust — most over 1,000 years old — burn up in the Earth’s atmosphere to create one of the best meteor showers of the year. The Perseids can be seen all over the sky, but the best viewing opportunities will be across the northern hemisphere. Those with sharp eyes will see that the meteors radiate from the direction of the constellation Perseus.
The latest from Bill McKibben has to be read and shared.
Introduction
We live in a world where there’s a great fondness for shortness, whether it’s headlines, soundbites, Twitter length ‘conversations’, text messages, and the rest. However, I’m introducing an essay from Bill McKibben that is long. When I use the word long I mean both literally, the essay is a shade under 6,200 words, and subjectively, the essay is long, very long, on meaning.
It was published in the August 2nd, 2012 issue of Rolling Stone. As Allyse of the 350.org team wrote in a widely distributed email,
Here at 350.org, we do a lot of our internal communication via online chat, and our written shorthand for “YES!” and “totally awesome!” and “you rock!” is “++”. Which is why I say to you: ++ Social Media Team, ++. You all rock.
Bill McKibben’s article in Rolling Stone—which we asked you to spread around the internet last week—has been shared on Facebook almost 100K times and seen by hundreds of thousands of people. Great work. If you haven’t read it yet, please do.
This article really lays out the intellectual framework for much of our work in the weeks, months, and years ahead. We want to keep pushing these ideas out there, especially this one: our objection to the fossil fuel industry is structural—these businesses are in fact planning to wreck the planet!
So we took a quote from Bill’s article and made it into a graphic that’s already been shared almost 2,500 times on Facebook. Will you help us push it past 5,000? Click here to share.
As you know if you’ve read the article, this is really an all-hands-on-deck moment for humanity. Thanks for doing your part—in ways both large and small.
Onward,
Allyse
Will you put aside some time, settle down in a comfortable chair, and read the article? Please do!
It crossed my mind to split it over a couple of days but I decided against that. But I have inserted a ‘click to reveal more’ about 1,100 words into the article – please do read on when you reach that point. And just as important, do comment!
Oh, want to see that image on Facebook that has been shared so widely? Here it is:
A’int that the truth!
Finally, feel free to share this as far and wide as you want. Thank you.
oooOOOooo
(Apart from the first image from Edel Rodriguez, all the other photographs have been inserted by me and are not in the original Rolling Stone production – I decided to insert them to make reading the article more visually attractive on a screen.)
Global Warming’s Terrifying New Math
Three simple numbers that add up to global catastrophe – and that make clear who the real enemy is
If the pictures of those towering wildfires in Colorado haven’t convinced you, or the size of your AC bill this summer, here are some hard numbers about climate change: June broke or tied 3,215 high-temperature records across the United States. That followed the warmest May on record for the Northern Hemisphere – the 327th consecutive month in which the temperature of the entire globe exceeded the 20th-century average, the odds of which occurring by simple chance were 3.7 x 10-99, a number considerably larger than the number of stars in the universe.
Meteorologists reported that this spring was the warmest ever recorded for our nation – in fact, it crushed the old record by so much that it represented the “largest temperature departure from average of any season on record.” The same week, Saudi authorities reported that it had rained in Mecca despite a temperature of 109 degrees, the hottest downpour in the planet’s history.
Not that our leaders seemed to notice. Last month the world’s nations, meeting in Rio for the 20th-anniversary reprise of a massive 1992 environmental summit, accomplished nothing. Unlike George H.W. Bush, who flew in for the first conclave, Barack Obama didn’t even attend. It was “a ghost of the glad, confident meeting 20 years ago,” the British journalist George Monbiot wrote; no one paid it much attention, footsteps echoing through the halls “once thronged by multitudes.” Since I wrote one of the first books for a general audience about global warming way back in 1989, and since I’ve spent the intervening decades working ineffectively to slow that warming, I can say with some confidence that we’re losing the fight, badly and quickly – losing it because, most of all, we remain in denial about the peril that human civilization is in.
When we think about global warming at all, the arguments tend to be ideological, theological and economic. But to grasp the seriousness of our predicament, you just need to do a little math. For the past year, an easy and powerful bit of arithmetical analysis first published by financial analysts in the U.K. has been making the rounds of environmental conferences and journals, but it hasn’t yet broken through to the larger public. This analysis upends most of the conventional political thinking about climate change. And it allows us to understand our precarious – our almost-but-not-quite-finally hopeless – position with three simple numbers.
 The point at which the sun reaches its farthest point north of the equator is the Summer Solstice, well it is for the Northern Hemisphere. This occurs annually on June 20 or June 21, depending on your time zone.