Category: Climate

We are what we eat!

So why do we insist of manipulating the genetics of food!

I read somewhere recently, and of course now can’t find the reference, that the genetic modification of our food represents as big a danger to the long-term survival  of man as does the damage to our biosphere.

So a recent item on the blog Food Freedom News jumped out at me.  This was an item that was introduced as, “The author of Seeds of Destruction (about Monsanto) has a new piece out on pesticides and mass animal deaths… very sobering.

Clicking on the ‘new piece’ link takes one to here, from which I quote the opening paragraphs,

Death of the Birds and the Bees Across America

By F. William Engdahl
Global Research

“A recent study showed that every human tested had the world’s best-selling pesticide, Roundup, detectable in their urine at concentrations between five and twenty times the level considered safe for drinking water.”

Birds and bees are something most of us take for granted as part of nature. The expression “teaching about the birds and the bees” to explain the process of human reproduction to young people is not an accidental expression. Bees and birds contribute to the essence of life on our planet. A study by the US Department of Agriculture estimated that “…perhaps one-third of our total diet is dependent, directly or indirectly, upon insect-pollinated plants.”

The honey bee, Apis mellifera, is the most important pollinator of agricultural crops. Honey bees pollinate over 70 out of 100 crops that in turn provide 90% of the world’s food. They pollinate most fruits and vegetables–including apples, oranges, strawberries, onions and carrots.  But while managed honey bee populations have increased over the last 50 years, bee colony populations have decreased significantly in many European and North American nations. Simultaneously, crops that are dependent on insects for pollination have increased. The phenomenon has received the curious designation of Colony Collapse Disorder (CCD), implying it could be caused by any number of factors. Serious recent scientific studies however point to a major cause: use of new highly toxic systemic pesticides in agriculture since about 2004.

That first paragraph alone made me sit up, “A recent study showed that every human tested had the world’s best-selling pesticide, Roundup, detectable in their urine at concentrations between five and twenty times the level considered safe for drinking water.”  What a strange race we are!
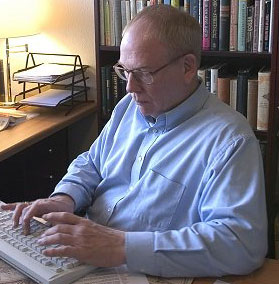
Wlliam F. Engdahl

Then it was easy to find out more information about the author of the book Seeds of Destruction, William F. Engdahl, including his website.  Mr. Engdahl is clearly no stranger to controversy as this YouTube video illustrates,

Back to that Food Freedom article.  Further on, there is evidence of the size of the problem in the UK,

Alarming UK results

A private UK research organization, Buglife and the Soil Association, undertook tests to try to determine cause of the bee death. They found that the decline was caused in part by a group of pesticides called neonicotinoids. Neonicotinoids are “systemic” chemicals that kill insects by getting into the cell of the plant. In Britain it’s widely used for crops like oilseed rape and for production of potted plants.

The neonicotinoids are found in the UK in products including Chinook, used on oilseed rape and Bayer UK 720, used in the production of potted plants which then ends up in gardens and homes around the country. The new study examined in detail the most comprehensive array of peer-reviewed research into possible long-term effects of neonicotinoid use. Their conclusion was that neonicotinoid pesticides damage the health and life cycle of bees over the long term by affecting the nervous system. The report noted, “Neonicotinoids may be a significant factor contributing to current bee declines and could also contribute to declines in other non-target invertebrate species.” The organization called for a total ban on pesticides containing any neonicotinoids.

The president of the UK Soil Association, Peter Melchett, told the press that pesticides were causing a continued decline in pollinating insects, risking a multimillion pound farming industry. “The UK is notorious for taking the most relaxed approach to pesticide safety in the EU; Buglife’s report shows that this puts at risk pollination services vital for UK agriculture,” he said.

Indeed in March 2012 Sir Robert Watson, Chief Scientist at the British Government’s Department of Environment announced that his government was reconsidering its allowance of neonicotinoid use in the UK. Watson told a British newspaper, “We will absolutely look at the University of Stirling work, the French work, and the American work that came out a couple of months ago. We must look at this in real detail to see whether or not the current British position is correct or is incorrect. I want this all reassessed, very, very carefully.”  To date no policy change has ensued however. Given the seriousness of the scientific studies and of the claims of danger, a prudent policy would have been to provisionally suspend further uise of neonicotinoids pending further research. No such luck.

And if the harm to bees wasn’t serious enough, try this extract,

Effect on Human Brain?

But most alarming of all is the evidence that exposure to neonicotinides has horrific possible effects on humans as well as on birds and bees.

Professor Henk Tennekes describes the effects:

“Today the major illnesses confronting children in the United States include a number of psychosocial and behavioral conditions. Neurodevelopmental disorders, including learning disabilities, dyslexia, mental retardation, attention deficit disorder, and autism – occurrence is more prevalent than previously thought, affecting 5 percent to 10 percent of the 4 million children born in the United States annually. Beyond childhood, incidence rates of chronic neurodegenerative diseases of adult life such as Parkinson’s disease and dementia have increased markedly. These trends raise the possibility that exposures in early life act as triggers of later illness, perhaps by reducing the numbers of cells in essential regions of the brain to below the level needed to maintain function in the face of advancing age. Prenatal and childhood exposures to pesticides have emerged as a significant risk factor explaining impacts on brain structure and health that can increase the risk of neurological disease later in life.”

There is also growing evidence suggesting persistent exposure to plants sprayed with neonicotinoids could be responsible for damage to the human brain, including the recent sharp rise in incidents of autism in children.

This really is an article that you should read in full, which also includes a full bibliography and notes section.  Plus you can leave your responses as a comment – go for it!
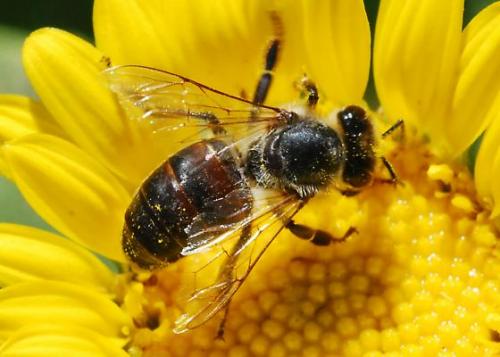
Apis mellifera – the honey bee (family Apidae)

There’s an old saying …

I’m thinking of this one.

There are those that do,

There are those that don’t,

There are those who wondered what happened!

So what prompted me bringing out that old saw?

Simply the ever-increasing rate of the loss of our Arctic sea ice.

Patrice Ayme commented recently on my post, The connection between man and climate.  This is part of what he wrote,

Arctic ice depletion can be tracked at: http://nsidc.org/arcticseaicenews/  It is now lower than the preceding lowest on July 5…

 Over on the Carbon Brief blog, we find a recent post (June 29th) that opens up thus,

The Guardian jumps the gun on record June sea ice melt

29 Jun 2012, 11:15 – Verity Payne

The Guardian this week reports that recent rapid melting of Arctic sea ice has seen levels reach a “record low for June”. But it’s premature to be heralding June 2012 as having record low Arctic sea ice extent before the month is even over, particularly as sea ice extent is not currently tracking at record low levels.

The Guardian article says Arctic sea ice “has melted faster this year than ever recorded before”, under the online headline “Arctic sea-ice levels at record low for June”.

This headline could be read in two ways. The first interpretation is that Arctic sea ice extent for the month of June is at a record low. But can we know that before the month is out? The second is that at some point in June Arctic sea ice was at a record low. But does highlighting a few days of sea ice behaviour best illustrate what’s happening to the sea ice?

The piece also appeared in the print version of the Guardian yesterday with the headline “Arctic sea ice has melted faster than ever, say scientists”.

Melt season

The Arctic sea ice is in long-term decline due to man made climate change, but it’s not a uniform decline – sea ice cover changes with the seasons, and the weather in the region affects how far the sea ice extends, particularly as it melts towards the ice minimum in late September.

During melt season, Arctic sea ice seems to get a lot of media attention, often with rather confusing results. This Guardian article was prompted by analysis from the US National Snow and Ice Data Center (NSIDC), who provide daily updates and regular analysis of Arctic sea ice conditions.

The mention of that Guardian Newspaper article is worth clicking through to, if only to enjoy the fabulous photograph, as below:

Scientists say Arctic sea ice has plummeted to its lowest levels ever this year. Photgraph: Steven J Kazlowski/Alamy

Back to that embedded link in the Carbon Brief posting to the US National Snow and Ice Data Center.  It reveals a wealth of important information.  Try this …

Rapid sea ice retreat in June

Arctic sea ice extent declined quickly in June, setting record daily lows for a brief period in the middle of the month. Strong ice loss in the Kara, Bering, and Beaufort seas, and Hudson and Baffin bays, led the overall retreat. Northern Hemisphere snow extent was unusually low in May and June, continuing a pattern of rapid spring snow melt seen in the past six years.

Overview of conditions

Arctic sea ice extent for June 2012 averaged 10.97 million square kilometers (4.24 million square miles). This was 1.18 million square kilometers (456,000 square miles) below the 1979 to 2000 average extent. The last three Junes (2010-2012) are the three lowest in the satellite record. June 2012 ice extent was 140,000 square kilometers (54,000 square miles) above the 2010 record low. Ice losses were notable in the Kara Sea, and in the Beaufort Sea, where a large polynya has formed. Retreat of ice in the Hudson and Baffin bays also contributed to the low June 2012 extent. The only area of the Arctic where sea ice extent is currently above average is along the eastern Greenland coast.

 Get your mind around this image that comes from the latest NSIDC report.

Arctic sea ice extent for June 2012 was 10.97 million square kilometers (4.24 million square miles). The magenta line shows the 1979 to 2000 median extent for that month. The black cross indicates the geographic North Pole. Sea Ice Index data. About the data

That old saying that I opened with, the one about There are those that do, etc.

No question in my mind that firmly in the camp of those that do is Mother Nature!  Anyone prepared?

Are you negligent, incompetent or complicit?

A guest post from Martin Lack points to the crux of the issue of denying man-caused climate change.

Introduction

I saw this post on Martin’s Blog Lack of Environment the day after I wrote a piece called In praise of fairness.  In my piece I mentioned the sad case of Mr. Bob Diamond and Martin continued with the theme in such a manner that I wanted to republish his article in full.  Here it is.

oooOOOooo

Are you negligent, incompetent or complicit?

This was a question posed to former Barclays CEO Bob Diamond this week, when he appeared before a Parliamentary Select Committee of MPs on Wednesday. It is a question that I would like to ask Dr Richard Lindzen… In fact, I have asked the question and – just as Bob Diamond did – he has refused to answer it… Here is the evidence on which you should decide for yourself:

Many readers will recall that, following my visit to London to hear Lindzen speak to a room full of fake sceptics in the Palace of Westminster on 22 February this year, I attempted to get some answers to questions. Unfortunately, I failed. I have been particularly frustrated by one thing; possibly the most misleading aspect of Lindzen’s entire presentation – a combination of graphs of recent atmospheric CO2 and temperature data that was mysteriously omitted from the PDF of the presentation that was initially posted on the Internet.  Although Lindzen never answered any of my questions, he did insert this slide into the PDF of his presentation despite my pointing out to him – MIT and the AGU – that it was essentially meaningless (as the y-axes could be stretched to show either correlation or no correlation as preferred by the speaker).

Here is a screenshot of the misleading graph from the video of the presentation:

Misrepresentation of data?
Steeply inclined Keeling curve versus apparently non-correlating temperature – if you stretched the temperature axis enough it would appear to correlate quite well. Therefore slide neither proves not disproves anything.

This bears more than a passing resemblance to the World Climate Widget – a very similar-looking combination of graphs (i.e. manipulated to suggest that there is no correlation between recent atmospheric CO2 and temperature data) – that can be downloaded as a widget from Anthony Watts’ Watts Up With That? (WUWT) misinformation blog.

If you go to the WUWT widget page, you will find the two graphs in both of these images (above and right) are there presented separately. However, to prove my point – that anyone using these graphs to try and prove there is no correlation between long-term CO2 and temperature changes – just look at what happens when you take the graph of University of Alabama at Huntsville (UAH) global lower atmosphere data as used by WUWT (i.e. cooler than surface temperature data) and stretch it:

Clearing the fog of data misrepresentation created by Lindzen et al. - Note the clear upward trend in the temperature graph on the left (it was there all the time).
Clearing the fog of data misrepresentation created by Lindzen et al. – Note the clear upward trend in the temperature graph on the left (it was there all the time).

Therefore, for anyone – including Lindzen – to try and use the original combination of graphs to suggest there is no correlation between CO2 and temperature, this suggests that they are either negligent, incompetent, or deliberately trying to mislead people. For many people who are not scientists to be fooled by this is understandable but, for a prominent scientist like Lindzen to make this mistake – and not apologise for doing so – is unforgivable. Furthermore, it would seem that, no matter how many times he is criticised, he just keeps repeating the same old mistakes: Skeptical Science: Lindzen and Choi 2011 – Party Like It’s 2009

It would appear that, despite the best efforts of the majority of prominent climate scientists, Lindzen’s London Illusions are still fooling a lot of people. If you follow that last link, it will take you to the website of what I prefer to call The Global Wonky Policy Foundation, where it is reported that only 43% of the British adult population felt able to agree with the following statement: “Global warming is a fact and is mostly caused by emissions from vehicles and industrial facilities”.

It has been suggested to me that this question is carefully phrased to deter people from saying “yes” (i.e. they might agree that warming is occurring and/or that humans are the primary cause; but they might not agree that vehicles and factories are the primary source of emissions). However, this is ‘clutching at straws’ in my opinion; and leaves me wondering what percentage of the population would feel able to agree with this statement:

“The sunrise is a fact and is mostly caused by the Earth not being flat and spinning once a day whilst orbiting the Sun”…?

oooOOOooo

I’m very grateful to Martin for allowing me to republish this.

The connection between man and climate.

The voice of science

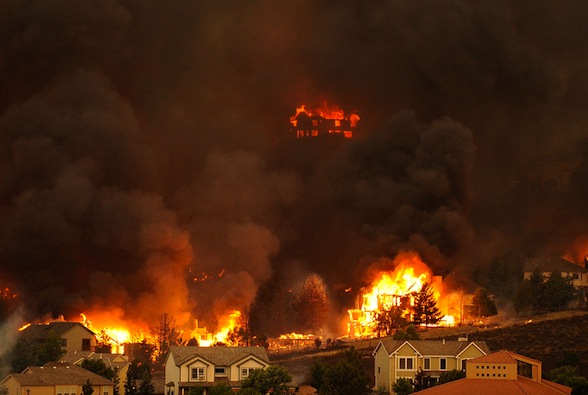
This summer has seen nature visiting on man a series of catastrophes.  To name just a few, we have the record-breaking rainfall in Britain in June, the Colorado wildfires and the 1,400,000 storm-struck households in the eastern US.

Colorado burning

Inevitably, many wonder if this is connected to climate change as a result of mankind’s behaviours.  Many now believe so.

But we have to stand on the rock of science.

So it was great to come across a recent article on Grist that led me to this organisation, Climate Communication.  As they say on the About Us page,

Climate Communication is a non-profit science and outreach project funded by the Rockefeller Brothers Fund and the ClimateWorks Foundation. Climate Communication operates as a project of the Aspen Global Change Institute, a non-profit organization dedicated to furthering the scientific understanding of Earth systems and global environmental change.

The article on Grist that had caught my eye was this one, Did climate change ’cause’ the Colorado wildfires? and within that article there was the link to Climate Communication, viz: That much we know with a high degree of confidence, as this excellent review of the latest science by Climate Communication makes clear.

That review on Climate Communication includes the following video,

Not convinced?

Then try this evidence from an interview with Kevin Trenberth of the National Center for Atmospheric Research shown on PBS Newshour,

Want more?  Go for it!

The PBS video came from the British Guardian newspaper (link thanks to Naked Capitalism).  The Guardian reported,

Is it now possible to blame extreme weather on global warming?

Wildfires, heatwaves and storms witnessed in the US are ‘what global warming looks like’, say climate scientists

Posted by Leo Hickman
Tuesday 3 July 2012

Whenever an episode of extreme weather – heatwave, flood, drought, etc – hits the headlines, someone somewhere is sure to point the finger of blame at human-induced climate change.

Such claims are normally slapped down with the much-aired mantra: “You cannot blame a single episode of bad weather on global warming.” But with the on-going record high temperatures affecting large parts of the US, there seems to be a noticeable reduction in such caveats and notes of caution.

This week, scientists have been queuing up, it seems, to explain how the wildfires in Colorado, the heatwave across the eastern seaboard, and the “super derecho” are all indicative of “what global warming looks like“. Most pulled back, though, from directly blaming global warming for such weather events.

“In the future you would expect larger, longer more intense heat waves and we’ve seen that in the last few summers,” Derek Arndt of NOAA Climate Monitoring told the Associated Press.” The same report added: “At least 15 climate scientists told the Associated Press that this long hot US summer is consistent with what is to be expected in global warming.”

So, can we now say, or not, that specific extreme weather events are caused, or at least exacerbated, by global warming? Has anything changed in climate scientists’ understanding of the attribution – or “anthropogenic fingerprint” – of such events? Are they now more confident about making such links?

I put this question to a number of climate scientists ….

Leo Hickman then reports the assessments of eight leading scientists.  Go and read their words here.  If you can do it now!

The science is solid!

So as you watch these scientists talking about the meaning of climate extremes think what you can do today to reduce your own impact on this planet.  Just as importantly, think how you can influence those around you and those that represent you that now is the time to wake up to the fact that nature is telling us to slow down!

As I said in a comment to a post on Tuesday,

The growth in awareness of what we are doing to the planet is astounding. There is hope, we have to promote hope and we have to acknowledge that hope is a powerful agent of change.

Hope via Openness

Don Tapscott presents what might just be humanity’s salvation.

Millions of us, of all ages, are linked together in this new ‘wired’ world.  For old crusties such as myself, it’s all too easy to recall the days when the mention of the word ‘chip’ immediately brought to mind fried fish!  But we struggled into this new world and now can’t imagine how it was in those earlier days – anyone want to buy my old quill pen? 😉

There are huge benefits to this wonderful networked world and most days I read something on a website here or a blog there that opens my mind in unfathomable ways.  Not only that, but the number of friends, new and old, who co-operate with my attempts to show how integrity is the only way forward is humbling.

Thus it was that an old friend of many years, Lee C., sent me a link to a recent TED talk that revealed in just 17 minutes a message of hope for all of us.  It reminded me that our younger generation have their own knowledge, their own aspirations, their own fears and dreams.

Without more ado, watch it now!

The recent generations have been bathed in connecting technology from birth, says futurist Don Tapscott, and as a result the world is transforming into one that is far more open and transparent. In this inspiring talk, he lists the four core principles that show how this open world can be a far better place.

And weren’t those flocks of starlings just breathtaking?

Lee also sent me this:

Don Tapscott’s recent TED talk ends with footage of starlings in vast numbers which is referred to as a ‘murmuration’. I watched it just two nights or so ago. Tonight I went outside for a breath of fresh air (ok a call of nature) and this is part of what I saw. So pleased to have had my mobile phone in my shirt pocket.

Finally, I hadn’t come across Don Tapscott before but thanks again to this amazing world of shared information, a quick Google search finds Don’s own website here.

Options for the future

That damn edge, embrace it or ….. or what?

It’s some ago that I read Lester Brown’s book World on the Edge but I still recall the effect it had on me.  Namely, this is not some environmentalist’s ‘willy waving’ but something that has the potential to hurt, I mean HURT!  Since the book was published the stream of information and evidence has turned into a flood of awareness that if we don’t change our ways soon then we, as in the vastness of human life, will go over the edge.

So it was a good reminder to come across a recent extract on the Earth Policy Institute website that is republished in full, as follows:

No previous civilization has survived the ongoing destruction of its natural supports. Nor will ours. Yet economists look at the future through a different lens. Relying heavily on economic data to measure progress, they see the near 10-fold growth in the world economy since 1950 and the associated gains in living standards as the crowning achievement of our modern civilization. During this period, income per person worldwide climbed nearly fourfold, boosting living standards to previously unimaginable levels. A century ago, annual growth in the world economy was measured in the billions of dollars. Today, it is measured in the trillions. In the eyes of mainstream economists, our present economic system has not only an illustrious past but also a promising future.

Mainstream economists see the 2008–09 global economic recession and near-collapse of the international financial system as a bump in the road, albeit an unusually big one, before a return to growth as usual. Projections of economic growth, whether by the World Bank, Goldman Sachs, or Deutsche Bank, typically show the global economy expanding by roughly 3 percent a year. At this rate the 2010 economy would easily double in size by 2035. With these projections, economic growth in the decades ahead is more or less an extrapolation of the growth of recent decades.

But natural scientists see that as the world economy expanded some 20-fold over the last century, it has revealed a flaw—a flaw so serious that if it is not corrected it will spell the end of civilization as we know it. At some point, what had been excessive local demands on environmental systems when the economy was small became global in scope.

A study by a team of scientists led by Mathis Wackernagel aggregates the use of the earth’s natural assets, including carbon dioxide overload in the atmosphere, into a single indicator—the ecological footprint. The authors concluded that humanity’s collective demands first surpassed the earth’s regenerative capacity around 1980. By 2007, global demands on the earth’s natural systems exceeded sustainable yields by 50 percent. Stated otherwise, it would take 1.5 Earths to sustain our current consumption. If we use environmental indicators to evaluate our situation, then the global decline of the economy’s natural support systems—the environmental decline that will lead to economic decline and social collapse—is well under way.

How did we get into this mess? Our market-based global economy as currently managed is in trouble. The market does many things well. It allocates resources with an efficiency that no central planner could even imagine, much less achieve.

However the market, which sets prices, is not telling us the truth. It is omitting indirect costs that in some cases now dwarf direct costs. Consider gasoline. Pumping oil, refining it into gasoline, and delivering the gas to U.S. service stations may cost, say, $3 per gallon. The indirect costs, including climate change, treatment of respiratory illnesses, oil spills, and the U.S. military presence in the Middle East to ensure access to the oil, total $12 per gallon. Similar calculations can be done for coal.

We delude ourselves with our accounting system. Leaving such huge costs off the books is a formula for bankruptcy. Environmental trends are the lead indicators telling us what lies ahead for the economy and ultimately for society itself. Falling water tables today signal rising food prices tomorrow. Shrinking polar ice sheets are a prelude to falling coastal real estate values.

Beyond this, mainstream economics pays little attention to the sustainable yield thresholds of the earth’s natural systems. Modern economic thinking and policymaking have created an economy that is so out of sync with the ecosystem on which it depends that it is approaching collapse. How can we assume that the growth of an economic system that is shrinking the earth’s forests, eroding its soils, depleting its aquifers, collapsing its fisheries, elevating its temperature, and melting its ice sheets can simply be projected into the long-term future? What is the intellectual process underpinning these extrapolations?

We are facing a situation in economics today similar to that in astronomy when Copernicus arrived on the scene, a time when it was believed that the sun revolved around the earth. Just as Copernicus had to formulate a new astronomical worldview after several decades of celestial observations and mathematical calculations, we too must formulate a new economic worldview based on several decades of environmental observations and analyses.

The archeological record indicates that civilizational collapse does not come suddenly out of the blue. Archeologists analyzing earlier civilizations talk about a decline-and-collapse scenario. Economic and social collapse was almost always preceded by a period of environmental decline.

For past civilizations it was sometimes a single environmental trend that was primarily responsible for their decline. Sometimes it was multiple trends. For Sumer, rising salt concentrations in the soil, as a result of an environmental flaw in the design of their otherwise extraordinary irrigation system, led to a decline in wheat yields. The Sumerians then shifted to barley, a more salt-tolerant crop. But eventually barley yields also began to decline. The collapse of the civilization followed.

For the Mayans, it was deforestation and soil erosion. As more and more land was cleared for farming to support the expanding empire, soil erosion undermined the productivity of their tropical soils. A team of scientists from the National Aeronautics and Space Administration has noted that the extensive land clearing by the Mayans likely also altered the regional climate, reducing rainfall. In effect, the scientists suggest, it was the convergence of several environmental trends, some reinforcing others, that led to the food shortages that brought down the Mayan civilization.

Although we live in a highly urbanized, technologically advanced society, we are as dependent on the earth’s natural support systems as the Sumerians and Mayans were. If we continue with business as usual, civilizational collapse is no longer a matter of whether but when. We now have an economy that is destroying its natural support systems, one that has put us on a decline and collapse path.

The reality of our situation may soon become clearer for mainstream economists as we begin to see some of the early economic effects of overconsuming the earth’s resources, such as rising world food prices. On the social front, the most disturbing trend is spreading hunger.

As rapid population growth continues, cropland becomes scarce, wells go dry, forests disappear, soils erode, unemployment rises, and hunger spreads. As environmental degradation and economic and social stresses mount, the more fragile governments are losing their capacity to govern. They become failing states—countries whose governments can no longer provide personal security, food security, or basic social services, such as education and health care. As the list of failing states grows longer each year, it raises a disturbing question: How many states must fail before our global civilization begins to unravel?

How much longer can we remain in the decline phase, whether measured in natural asset liquidation, spreading hunger, or failing states, before our global civilization begins to break down? We are dangerously close to the edge. Peter Goldmark, former Rockefeller Foundation president, puts it well: “The death of our civilization is no longer a theory or an academic possibility; it is the road we’re on.”

Adapted from World on the Edge by Lester R. Brown.  The message is clear.

But if you haven’t read the book it’s available online, for free!  Just go here and not only will you find the link to the book but also links to other valuable materials.

Founder and President of the Earth Policy Institute, Lester Brown, speaks about his new book World on the Edge: How to Prevent Environmental and Economic Collapse. The issues, says Brown, are critical — and the big question is whether we can change direction before “we go over the edge.” Among his points: solar, wind and geothermal energy, with energy efficiency, can provide all the power we need, but a massive effort must be made now to fully shift to these clean, safe, renewable energy technologies. He strongly rejects nuclear power.

Dear George!

The sad story of the death of Lonesome George, a giant tortoise.

When you’re gone, you’re gone, it is said.  But in the case of this example of the beauty of Mother Nature, the idea of being gone is as final as it comes; George was the last of his species.

Here’s how the BBC reported the story,

Last Pinta giant tortoise Lonesome George dies

Staff at the Galapagos National Park in Ecuador say Lonesome George, a giant tortoise believed to be the last of its subspecies, has died.

Scientists estimate he was about 100 years old.

Park officials said they would carry out a post-mortem to determine the cause of his death.

With no offspring and no known individuals from his subspecies left, Lonesome George became known as the rarest creature in the world.

For decades, environmentalists unsuccessfully tried to get the Pinta Island tortoise to reproduce with females from a similar subspecies on the Galapagos Islands.

Park officials said the tortoise was found dead in his corral by his keeper of 40 years, Fausto Llerena.

While his exact age was not known, Lonesome George was estimated to be about 100, which made him a young adult as the subspecies can live up to an age of 200.

Lonesome George was first seen by a Hungarian scientist on the Galapagos island of Pinta in 1972.

Environmentalists had believed his subspecies(Chelonoidis nigra abingdoni) had become extinct.

Lonesome George became part of the Galapagos National Park breeding programme.

After 15 years of living with a female tortoise from the nearby Wolf volcano, Lonesome George did mate, but the eggs were infertile.

He also shared his corral with female tortoises from Espanola island, which are genetically closer to him than those from Wolf volcano, but Lonesome George failed to mate with them.

He became a symbol of the Galapagos Islands, which attract some 180,000 visitors a year.

Galapagos National Park officials said that with George’s death, the Pinta tortoise subspecies has become extinct.

They said his body would probably be embalmed to conserve him for future generations.

Tortoises were plentiful on the Galapagos islands until the late 19th century, but were later hunted for their meat by sailors and fishermen to the point of extinction.

Their habitat furthermore suffered when goats were introduced from the mainland.

The differences in appearance between tortoises from different Galapagos islands were among the features which helped the British naturalist Charles Darwin formulate his theory of evolution.

Some 20,000 giant tortoises of other subspecies still live on the Galapagos.

Continuing the tribute, Chris Mazzarella had some stunning photographs on his wonderful photographic blogsite Fast Forward. (Do take a look!) I held my breath and asked Chris for permission to republish his article and was delighted to be given his approval.  Thanks Chris, thanks very much.

oooOOOooo

An Ode To George

To pay tribute to our late friend Lonesome George, I thought it would be appropriate to write a post in celebration of turtles. George was the last tortoise of the subspecies Chelonoidis nigra abingdoni from Pinta Island in the Galapagos. Sadly George passed yesterday at the tender age of 100 years. This could be considered middle aged for the tortoise who’s counterparts can live beyond 200 years.

This is easily the smallest one I’ve seen all year. To give you some perspective, this lily pad is about eight inches across.

In Vermont, we have seven species of turtles, and I run into many of them while kayaking around the state. The one I see most often is the painted turtle. I spot these guys by the dozen basking in the sun while I’m paddling throughout the northeast. They are very cooperative subjects, but will head for a swim if you get too close. I don’t like spoiling anyone’s sunbath so I do my best to keep a respectable distance out on the water.

You can check out the biggest turtle I’ve seen all year in an April post entitled Snappers.

I’ve read that snapping turtles are the most common turtle in Vermont, yet I do not see quite as many in my travels. When I do see them, they are usually trolling underwater, covered in algae.

I have encountered a few snappers above the surface this year. I found this old guy lounging on a log in Bradford, Vermont a few days ago.

One of the rarer species of turtle I encountered this spring was a wood turtle in Magalloway Brook. I didn’t have much time to prepare for this shot before he launched off the log and into the water. It was a brief meeting, but certainly a memorable one as this is the only wood turtle I’ve ever photographed.

While turtles are not known for their speed they do offer unique challenges for photographers, particularly when shooting in the sun. Their reflective carapace makes them easy to spot, but difficult to expose for. A polarizing filter is sometimes necessary to reduce the glare on their wet shells. While this will help, the ideal situation is to shoot them under overcast skies.

Another thing to keep in mind is the angle of your shot. The kayak makes a great vehicle for wildlife photography because it keeps you low on the water. I often try to shoot wildlife at eye level. This gives you the same perspective from which the animal views the world. It’s much more interesting than a bird’s eye view, for example, and embodies the subject with the sense of pride that it deserves.

George’s passing marks the end of an important legacy, as the Galapagos turtles played a very important role in the foundation of Darwin’s theory of Natural Selection.

To learn more and see photos of George check out this great article by Jess Zimmerman at Grist.org.

We salute you George!

oooOOOooo

What stunningly beautiful photographs.  Once again, Chris, thanks for your permission to republish your Ode.

Finally, going back to 2009 there’s a BBC video of Simon Reeve visiting Lonesome George while visiting the Galapagos islands.

It’s really quite simple.

David Roberts of Grist offers a very clear message.

But before going to the piece, just let me say why there’s been a preponderance of climate change articles on Learning from Dogs.  Two reasons come to mind.  The first one is that this blog’s primary theme is integrity.  The idea of writing about what we can learn from the closest species to man, the domesticated dog, came out of the understanding that dogs are integrous creatures.  As I concluded in the Purpose of this blog,

Or, possibly, it’s more accurate to say that our civilisation is under threat and the time left to change our ways, to embrace those qualities of integrity, truth and consciousness for the very planet we all live on, is running out.

So what has this to do with dogs? Simply that man’s best friend, a relationship that goes back tens of thousands of years, is still a wonderful example of the many qualities that we need now for the very survival of the human species.

The second reason is that as many will be aware it is the G20 gathering this week and the more that millions around the world add their demand for common-sense and reason the better that will be.  Again, honesty and integrity, values not usually associated with the world’s political leaders, must come to the fore.

So now to the recent piece from Grist.

Climate change is simple: We do something or we’re screwed

By David Roberts

Back in April, The Evergreen State College invited me to speak at a TEDx event called “Hello Climate Change: Rethinking the Unthinkable.” Videos from the event are now online.

My talk was called “Climate change is simple.” I’m proud to say that I used only 17 of my allotted 15 minutes.

I’ve put an annotated version of my slideshow beneath the video, linking to sources and adding thoughts. The only thing I’ll say about the video itself is that I’ve always thought these things would be better with a soundtrack. If anybody out there on the web wants to make a mashup with it, add some good beats, be my guest.

This is the video of David’s talk.

And in case you think this is all green paranoia, then spend a couple of minutes watching this,

A group of scientists from around the world who are part of The Berkeley Initiative in Global Change Biology (BiGCB) is warning that an ever-growing population and widespread destruction of natural ecosystems may be driving Earth toward a planet-wide tipping point, an irreversible change in the biosphere with unpredictable consequences. Anthony Barnosky, professor of integrative biology at the University of California, Berkeley, is the lead author of a review paper about this issue in the journal Nature.
For full story: NewsCenter.berkeley.edu
Video by Roxanne Makasdjian, UC Berkeley Media Relations

NB. I found the sound levels on these videos to be rather low – hope you can hear them clearly.

Changing our fuel would be a great move.

A recommendation to watch this film.

I’m talking about the film Fuel which Jean and I watched on Monday night.

Here’s the trailer,

This movie trailer gives insight into the impeding oil dependency problem and hints at the biofuel solution. The Fuel Film raises awareness of 9/11, global warming, and moreover, how we can switch to an alternative fuel called biofuel. It is based on renewable sources such as algae or ethanol, costs less, and combats the impeding destruction of the environment.

But Top Documentary Films has the full film available, the link is here. (And see below)  TDF describe the film, thus,

Eleven years in the making, FUEL is the in-depth personal journey of filmmaker and eco-evangelist Josh Tickell, who takes us on a hip, fast-paced road trip into America’s dependence on foreign oil.

Combining a history lesson of the US auto and petroleum industries and interviews with a wide range of policy makers, educators, and activists such as Woody Harrelson, Sheryl Crow, Neil Young and Willie Nelson.

Animated by powerful graphics, FUEL looks into our future offering hope via a wide-range of renewable energy and bio-fuels. Winner of the Sundance Audience Award.

The events of Sept. 11 and Hurricane Katrina factor in both visually and thematically, providing provocative anchors for the movie’s indictment of what Tickell believes is the Big Oil-cozy, ecologically indifferent Bush administration.

Johnny O’Hara’s WGA Award-nominated script doesn’t dwell on muckraking, however; it’s more focused on broadly inspiring viewers than preaching to the converted.

Interviews with a wide range of environmentalists, policy makers and educators, along with such “green” celebrities as Woody Harrelson, Sheryl Crow and Larry Hagman offer serious fuel for thought – as well as for action.
Smartly animated interstitials, memorable archival material and a lively soundtrack round out the fast-paced proceedings.

Have to say that the film was powerful and compelling and a great reminder that a sustainable way of life for all of us doesn’t mean the end of the world as we know it.  Far from it; the word ‘sustainable’ is the clue here!

Here’s the full film,

Director Josh Tickell takes us along for his 11 year journey around the world to find solutions to America’s addiction to oil. A shrinking economy, a failing auto industry, rampant unemployment, an out-of-control national debt, and an insatiable demand for energy weigh heavily on all of us. Fuel shows us the way out of the mess we’re in by explaining how to replace every drop of oil we now use, while creating green jobs and keeping our money here at home. The film never dwells on the negative, but instead shows us the easy solutions already within our reach.

Finally, a little footnote for all you Planet watchers out there.  Summer starts, as in the summer solstice, today (the 20th) in North America at 7:09 P.M. EDT (UTC -4 hours) or 4:09 P.M. MST (UTC -7 hours) and in the UK at 23:09 UTC.