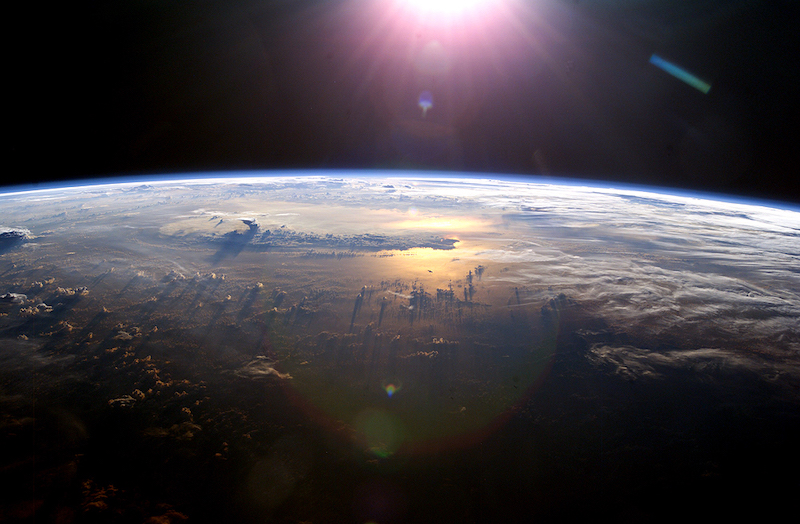
Category: Climate

The geological history of Planet Earth

We live on a profoundly ancient and beautiful planet.

I follow the photographic website Ugly Hedgehog and have been doing for some time. There has been a post recently from the section Photo Gallery and ‘greymule’ from Colorado called his entry ‘A Couple of Desert Scenes’ and I will display just one of his images from that post.

It makes a wonderful connection to today’s post which is from The Conversation.

ooOOoo

Evidence from Snowball Earth found in ancient rocks on Colorado’s Pikes Peak – it’s a missing link

Rocks can hold clues to history dating back hundreds of millions of years. Christine S. Siddoway

Liam Courtney-Davies, University of Colorado Boulder; Christine Siddoway, Colorado College, and Rebecca Flowers, University of Colorado Boulder

Around 700 million years ago, the Earth cooled so much that scientists believe massive ice sheets encased the entire planet like a giant snowball. This global deep freeze, known as Snowball Earth, endured for tens of millions of years.

Yet, miraculously, early life not only held on, but thrived. When the ice melted and the ground thawed, complex multicellular life emerged, eventually leading to life-forms we recognize today.

The Snowball Earth hypothesis has been largely based on evidence from sedimentary rocks exposed in areas that once were along coastlines and shallow seas, as well as climate modeling. Physical evidence that ice sheets covered the interior of continents in warm equatorial regions had eluded scientists – until now.

In new research published in the Proceedings of the National Academy of Sciences, our team of geologists describes the missing link, found in an unusual pebbly sandstone encapsulated within the granite that forms Colorado’s Pikes Peak.

An illustration of an icy earth viewed from space
Earth iced over during the Cryogenian Period, but life on the planet survived. NASA illustration

Solving a Snowball Earth mystery on a mountain

Pikes Peak, originally named Tavá Kaa-vi by the Ute people, lends its ancestral name, Tava, to these notable rocks. They are composed of solidified sand injectites, which formed in a similar manner to a medical injection when sand-rich fluid was forced into underlying rock.

A possible explanation for what created these enigmatic sandstones is the immense pressure of an overlying Snowball Earth ice sheet forcing sediment mixed with meltwater into weakened rock below.

A hand holds a rock with dark seams through it and other colors.
Dark red to purple bands of Tava sandstone dissect pink and white granite. The Tava is also cross-cut by silvery-gray veins of iron oxide. Liam Courtney-Davies

An obstacle for testing this idea, however, has been the lack of an age for the rocks to reveal when the right geological circumstances existed for sand injection.

We found a way to solve that mystery, using veins of iron found alongside the Tava injectites, near Pikes Peak and elsewhere in Colorado.

A cliff side showing a long strip of lighter color Tava cutting through Pikes Peak Granite. The injectite here is 5 meters tall
A 5-meter-tall, almost vertical Tava dike is evident in this section of Pikes Peak granite. Liam Courtney-Davies

Iron minerals contain very low amounts of naturally occurring radioactive elements, including uranium, which slowly decays to the element lead at a known rate. Recent advancements in laser-based radiometric dating allowed us to measure the ratio of uranium to lead isotopes in the iron oxide mineral hematite to reveal how long ago the individual crystals formed.

The iron veins appear to have formed both before and after the sand was injected into the Colorado bedrock: We found veins of hematite and quartz that both cut through Tava dikes and were crosscut by Tava dikes. That allowed us to figure out an age bracket for the sand injectites, which must have formed between 690 million and 660 million years ago.

So, what happened?

The time frame means these sandstones formed during the Cryogenian Period, from 720 million to 635 million years ago. The name is derived from “cold birth” in ancient Greek and is synonymous with climate upheaval and disruption of life on our planet – including Snowball Earth.

While the triggers for the extreme cold at that time are debated, prevailing theories involve changes in tectonic plate activity, including the release of particles into the atmosphere that reflected sunlight away from Earth. Eventually, a buildup of carbon dioxide from volcanic outgassing may have warmed the planet again.

University of Exeter professor Timothy Lenton explains why the Earth was able to freeze over.

The Tava found on Pikes Peak would have formed close to the equator within the heart of an ancient continent named Laurentia, which gradually over time and long tectonic cycles moved into its current northerly position in North America today.

The origin of Tava rocks has been debated for over 125 years, but the new technology allowed us to conclusively link them to the Cryogenian Snowball Earth period for the first time.

The scenario we envision for how the sand injection happened looks something like this:

A giant ice sheet with areas of geothermal heating at its base produced meltwater, which mixed with quartz-rich sediment below. The weight of the ice sheet created immense pressures that forced this sandy fluid into bedrock that had already been weakened over millions of years. Similar to fracking for natural gas or oil today, the pressure cracked the rocks and pushed the sandy meltwater in, eventually creating the injectites we see today.

Clues to another geologic puzzle

Not only do the new findings further cement the global Snowball Earth hypothesis, but the presence of Tava injectites within weak, fractured rocks once overridden by ice sheets provides clues about other geologic phenomena.

Time gaps in the rock record created through erosion and referred to as unconformities can be seen today across the United States, most famously at the Grand Canyon, where in places, over a billion years of time is missing. Unconformities occur when a sustained period of erosion removes and prevents newer layers of rock from forming, leaving an unconformable contact.

Unconformity in the Grand Canyon is evident here where horizontal layers of 500-million-year-old rock sit on top of a mass of 1,800-million-year-old rocks. The unconformity, or ‘time gap,’ demonstrates that years of history are missing. Mike Norton via Wikimedia, CC BY-SA

Our results support that a Great Unconformity near Pikes Peak must have been formed prior to Cryogenian Snowball Earth. That’s at odds with hypotheses that attribute the formation of the Great Unconformity to large-scale erosion by Snowball Earth ice sheets themselves.

We hope the secrets of these elusive Cryogenian rocks in Colorado will lead to the discovery of further terrestrial records of Snowball Earth. Such findings can help develop a clearer picture of our planet during climate extremes and the processes that led to the habitable planet we live on today.

Liam Courtney-Davies, Postdoctoral Research Associate in Geological Sciences, University of Colorado Boulder; Christine Siddoway, Professor of Geology, Colorado College, and Rebecca Flowers, Professor of Geological Sciences, University of Colorado Boulder

This article is republished from The Conversation under a Creative Commons license. Read the original article.

ooOOoo

All I can add is fascinating.

The summer of 2024 in the Northern Hemisphere.

Once more, an article on the changing climate.

Recently, the BBC News reported that:

Global efforts to tackle climate change are wildly off track, says the UN, as new data shows that warming gases are accumulating faster than at any time in human existence.

Current national plans to limit carbon emissions would barely cut pollution by 2030, the UN analysis shows, leaving efforts to keep warming under 1.5C this century in tatters.

The update comes as a separate report shows that greenhouse gases have risen by over 11% in the last two decades, with atmospheric concentrations surging in 2023.

ooOOoo

What the jet stream and climate change had to do with the hottest summer on record − remember all those heat domes?

Shuang-Ye Wu, University of Dayton

Summer 2024 was officially the Northern Hemisphere’s hottest on record. In the United States, fierce heat waves seemed to hit somewhere almost every day.

Phoenix reached 100 degrees for more than 100 days straight. The 2024 Olympic Games started in the midst of a long-running heat wave in Europe that included the three hottest days on record globally, July 21-23. August was Earth’s hottest month in the National Oceanic and Atmospheric Administration’s 175-year record.

Overall, the global average temperature was 2.74 degrees Fahrenheit (1.52 degrees Celsius) above the 20th-century average.

That might seem small, but temperature increases associated with human-induced climate change do not manifest as small, even increases everywhere on the planet. Rather, they result in more frequent and severe episodes of heat waves, as the world saw in 2024.

The most severe and persistent heat waves are often associated with an atmospheric pattern called a heat dome. As an atmospheric scientist, I study weather patterns and the changing climate. Here’s how heat domes, the jet stream and climate change influence summer heat waves and the record-hot summer of 2024.

What the jet stream has to do with heat domes

If you listened to weather forecasts during the summer of 2024, you probably heard the term “heat dome” a lot.

A heat dome is a persistent high-pressure system over a large area. A high-pressure system is created by sinking air. As air sinks, it warms up, decreasing relative humidity and leaving sunny weather. The high pressure also serves as a lid that keeps hot air on the surface from rising and dissipating. The resulting heat dome can persist for days or even weeks.

The longer a heat dome lingers, the more heat will build up, creating sweltering conditions for the people on the ground.

A 3D image of the US showing a heat dome above it.
High pressure in the middle layers of the atmosphere acts as a dome or cap, allowing heat to build up at the Earth’s surface. NOAA

How long these heat domes stick around has a lot to do with the jet stream.

The jet stream is a narrow band of strong winds in the upper atmosphere, about 30,000 feet above sea level. It moves from west to east due to the Earth’s rotation. The strong winds are a result of the sharp temperature difference where the warm tropical air meets the cold polar air from the north in the mid-latitudes.

The jet stream does not flow along a straight path. Rather, it meanders to the north and south in a wavy pattern. These giant meanders are known as the Rossby waves, and they have a major influence on weather.

An illustration shows how ridges create high pressure to the south of them and troughs create low pressure to the north of them.
Ridges and troughs created as the jet stream meanders through the mid-latitudes create high (H) and low (L) pressure systems. Reds indicate the fastest winds. NASA/Goddard Space Flight Center Scientific Visualization Studio

Where the jet stream arcs northward, forming a ridge, it creates a high-pressure system south of the wave. Where the jet stream dips southward, forming a trough, it creates a low-pressure system north of the jet stream. A low-pressure system contains rising air in the center, which cools and tends to generate precipitation and storms.

Most of our weather is modulated by the position and characteristics of the jet stream.

How climate change affects the jet stream

The jet stream, or any wind, is the result of differences in surface temperature.

In simple terms, warm air rises, creating low pressure, and cold air sinks, creating high pressure. Wind is the movement of the air from high to low pressure. Greater differences in temperature produce stronger winds.

For the Earth as a whole, warm air rises near the equator, and cold air sinks near the poles. The temperature difference between the equator and the pole determines the strength of the jet stream in each hemisphere.

However, that temperature difference has been changing, particularly in the Northern Hemisphere. The Arctic region has been warming about three times faster than the global average. This phenomenon, known as Arctic amplification, is largely caused by the melting of Arctic sea ice, which allows the exposed dark water to absorb more of the Sun’s radiation and heat up faster.

Because the Arctic is warming faster than the tropics, the temperature difference between the two regions is lessened. And that slows the jet stream.

As the jet stream slows, it tends to meander more, causing bigger waves. The bigger waves create larger high-pressure systems. These can often be blocked by the deep low-pressure systems on both sides, causing the high-pressure system to sit over a large area for a long period of time.

A stagnant polar jet stream can trapped heat over parts of North America, Europe and Asia at the same time. This example happened in July 2023. UK Met Office

Typically, waves in the jet stream pass through the continental United States in around three to five days. When blocking occurs, however, the high-pressure system could stagnate for days to weeks. This allows the heat to build up underneath, leading to blistering heat waves.

Since the jet stream circles around the globe, stagnating waves could occur in multiple places, leading to simultaneous heat waves at the mid-latitude around the world. That happened in 2024, with long-lasting heat waves in Europe, North America, Central Asia and China.

Jet stream behavior affects winter, too

The same meandering behavior of the jet stream also plays a role in extreme winter weather. That includes the southward intrusion of frigid polar air from the polar vortex and conditions for severe winter storms.

Many of these atmospheric changes, driven by human-caused global warming, have significant impacts on people’s health, property and ecosystems around the world.

Shuang-Ye Wu, Professor of Geology and Environmental Geosciences, University of Dayton

This article is republished from The Conversation under a Creative Commons license. Read the original article.

ooOOoo

I maybe approaching my own end of life but millions of others are younger than me. When I see a woman with a young baby in her arms I cannot stop myself from wondering what that generation is going to do.

The changing climate

Here is one explanation.

There is no question the world’s weather systems are changing. However, for folk who are not trained in this science it is all a bit mysterious. So thank goodness that The Conversation have not only got a scientist who does know what he is talking about but also they are very happy for it to be republished.

ooOOoo

Atmospheric rivers are shifting poleward, reshaping global weather patterns

Atmospheric rivers are long filaments of moisture that curve poleward. Several are visible in this satellite image. Bin Guan, NASA/JPL-Caltech and UCLA

Zhe Li, University Corporation for Atmospheric Research

Atmospheric rivers – those long, narrow bands of water vapor in the sky that bring heavy rain and storms to the U.S. West Coast and many other regions – are shifting toward higher latitudes, and that’s changing weather patterns around the world.

The shift is worsening droughts in some regions, intensifying flooding in others, and putting water resources that many communities rely on at risk. When atmospheric rivers reach far northward into the Arctic, they can also melt sea ice, affecting the global climate.

In a new study published in Science Advances, University of California, Santa Barbara, climate scientist Qinghua Ding and I show that atmospheric rivers have shifted about 6 to 10 degrees toward the two poles over the past four decades.

Atmospheric rivers on the move

Atmospheric rivers aren’t just a U.S West Coast thing. They form in many parts of the world and provide over half of the mean annual runoff in these regions, including the U.S. Southeast coasts and West Coast, Southeast Asia, New Zealand, northern Spain, Portugal, the United Kingdom and south-central Chile.

California relies on atmospheric rivers for up to 50% of its yearly rainfall. A series of winter atmospheric rivers there can bring enough rain and snow to end a drought, as parts of the region saw in 2023.

Atmospheric rivers occur all over the world, as this animation of global satellite data from February 2017 shows. NASA/Goddard Space Flight Center Scientific Visualization Studio

While atmospheric rivers share a similar origin – moisture supply from the tropics – atmospheric instability of the jet stream allows them to curve poleward in different ways. No two atmospheric rivers are exactly alike.

What particularly interests climate scientists, including us, is the collective behavior of atmospheric rivers. Atmospheric rivers are commonly seen in the extratropics, a region between the latitudes of 30 and 50 degrees in both hemispheres that includes most of the continental U.S., southern Australia and Chile.

Our study shows that atmospheric rivers have been shifting poleward over the past four decades. In both hemispheres, activity has increased along 50 degrees north and 50 degrees south, while it has decreased along 30 degrees north and 30 degrees south since 1979. In North America, that means more atmospheric rivers drenching British Columbia and Alaska.

A global chain reaction

One main reason for this shift is changes in sea surface temperatures in the eastern tropical Pacific. Since 2000, waters in the eastern tropical Pacific have had a cooling tendency, which affects atmospheric circulation worldwide. This cooling, often associated with La Niña conditions, pushes atmospheric rivers toward the poles.

The poleward movement of atmospheric rivers can be explained as a chain of interconnected processes.

During La Niña conditions, when sea surface temperatures cool in the eastern tropical Pacific, the Walker circulation – giant loops of air that affect precipitation as they rise and fall over different parts of the tropics – strengthens over the western Pacific. This stronger circulation causes the tropical rainfall belt to expand. The expanded tropical rainfall, combined with changes in atmospheric eddy patterns, results in high-pressure anomalies and wind patterns that steer atmospheric rivers farther poleward.

An animation of satellite data shows sea surface temperatures changing over months along the equator in the eastern Pacific Ocean. When they're warmer than normal, that indicates El Niño forming. Cooler than normal indicates La Nina.
La Niña, with cooler water in the eastern Pacific, fades, and El Niño, with warmer water, starts to form in the tropical Pacific Ocean in 2023. NOAA Climate.gov

Conversely, during El Niño conditions, with warmer sea surface temperatures, the mechanism operates in the opposite direction, shifting atmospheric rivers so they don’t travel as far from the equator.

The shifts raise important questions about how climate models predict future changes in atmospheric rivers. Current models might underestimate natural variability, such as changes in the tropical Pacific, which can significantly affect atmospheric rivers. Understanding this connection can help forecasters make better predictions about future rainfall patterns and water availability.

Why does this poleward shift matter?

A shift in atmospheric rivers can have big effects on local climates.

In the subtropics, where atmospheric rivers are becoming less common, the result could be longer droughts and less water. Many areas, such as California and southern Brazil, depend on atmospheric rivers for rainfall to fill reservoirs and support farming. Without this moisture, these areas could face more water shortages, putting stress on communities, farms and ecosystems.

In higher latitudes, atmospheric rivers moving poleward could lead to more extreme rainfall, flooding and landslides in places such as the U.S. Pacific Northwest, Europe, and even in polar regions.

A long narrow band of moisture sweeps up toward California, crossing hundreds of miles of Pacific Ocean.
A satellite image on Feb. 20, 2017, shows an atmospheric river stretching from Hawaii to California, where it brought drenching rain. NASA/Earth Observatory/Jesse Allen

In the Arctic, more atmospheric rivers could speed up sea ice melting, adding to global warming and affecting animals that rely on the ice. An earlier study I was involved in found that the trend in summertime atmospheric river activity may contribute 36% of the increasing trend in summer moisture over the entire Arctic since 1979.

What it means for the future

So far, the shifts we have seen still mainly reflect changes due to natural processes, but human-induced global warming also plays a role. Global warming is expected to increase the overall frequency and intensity of atmospheric rivers because a warmer atmosphere can hold more moisture.

How that might change as the planet continues to warm is less clear. Predicting future changes remains uncertain due largely to the difficulty in predicting the natural swings between El Niño and La Niña, which play an important role in atmospheric river shifts.

As the world gets warmer, atmospheric rivers – and the critical rains they bring – will keep changing course. We need to understand and adapt to these changes so communities can keep thriving in a changing climate.

Zhe Li, Postdoctoral Researcher in Earth System Science, University Corporation for Atmospheric Research

This article is republished from The Conversation under a Creative Commons license. Read the original article.

ooOOoo

Those last two paragraphs of the above article show the difficulty in coming up with clear predictions of the future. As was said: ‘How that might change as the planet continues to warm is less clear. Predicting future changes remains uncertain due largely to the difficulty in predicting the natural swings between El Niño and La Niña, which play an important role in atmospheric river shifts.

Ancient times

This attracted me very much, and I wanted to share it with you.

The opening paragraph of this article caught my eye so I read it fully. As it was published in The Conversation then that meant I could republish it.

ooOOoo

Centuries ago, the Maya storm god Huracán taught that when we damage nature, we damage ourselves

James L. Fitzsimmons, Middlebury

The ancient Maya believed that everything in the universe, from the natural world to everyday experiences, was part of a single, powerful spiritual force. They were not polytheists who worshipped distinct gods but pantheists who believed that various gods were just manifestations of that force.

Some of the best evidence for this comes from the behavior of two of the most powerful beings of the Maya world: The first is a creator god whose name is still spoken by millions of people every fall – Huracán, or “Hurricane.” The second is a god of lightning, K’awiil, from the early first millennium C.E.

As a scholar of the Indigenous religions of the Americas, I recognize that these beings, though separated by over 1,000 years, are related and can teach us something about our relationship to the natural world.

Huracán, the ‘Heart of Sky’

Huracán was once a god of the K’iche’, one of the Maya peoples who today live in the southern highlands of Guatemala. He was one of the main characters of the Popol Vuh, a religious text from the 16th century. His name probably originated in the Caribbean, where other cultures used it to describe the destructive power of storms.

The K’iche’ associated Huracán, which means “one leg” in the K’iche’ language, with weather. He was also their primary god of creation and was responsible for all life on earth, including humans.

Because of this, he was sometimes known as U K’ux K’aj, or “Heart of Sky.” In the K’iche’ language, k’ux was not only the heart but also the spark of life, the source of all thought and imagination.

Yet, Huracán was not perfect. He made mistakes and occasionally destroyed his creations. He was also a jealous god who damaged humans so they would not be his equal. In one such episode, he is believed to have clouded their vision, thus preventing them from being able to see the universe as he saw it.

Huracán was one being who existed as three distinct persons: Thunderbolt Huracán, Youngest Thunderbolt and Sudden Thunderbolt. Each of them embodied different types of lightning, ranging from enormous bolts to small or sudden flashes of light.

Despite the fact that he was a god of lightning, there were no strict boundaries between his powers and the powers of other gods. Any of them might wield lightning, or create humanity, or destroy the Earth.

Another storm god

The Popol Vuh implies that gods could mix and match their powers at will, but other religious texts are more explicit. One thousand years before the Popol Vuh was written, there was a different version of Huracán called K’awiil. During the first millennium, people from southern Mexico to western Honduras venerated him as a god of agriculture, lightning and royalty.

A drawing showing a reclining god-like figure with a large snake around him.
The ancient Maya god K’awiil, left, had an ax or torch in his forehead as well as a snake in place of his right leg. K5164 from the Justin Kerr Maya archive, Dumbarton Oaks, Trustees for Harvard University, Washington, D.C.

Illustrations of K’awiil can be found everywhere on Maya pottery and sculpture. He is almost human in many depictions: He has two arms, two legs and a head. But his forehead is the spark of life – and so it usually has something that produces sparks sticking out of it, such as a flint ax or a flaming torch. And one of his legs does not end in a foot. In its place is a snake with an open mouth, from which another being often emerges.

Indeed, rulers, and even gods, once performed ceremonies to K’awiil in order to try and summon other supernatural beings. As personified lightning, he was believed to create portals to other worlds, through which ancestors and gods might travel.

Representation of power

For the ancient Maya, lightning was raw power. It was basic to all creation and destruction. Because of this, the ancient Maya carved and painted many images of K’awiil. Scribes wrote about him as a kind of energy – as a god with “many faces,” or even as part of a triad similar to Huracán.

He was everywhere in ancient Maya art. But he was also never the focus. As raw power, he was used by others to achieve their ends.

Rain gods, for example, wielded him like an ax, creating sparks in seeds for agriculture. Conjurers summoned him, but mostly because they believed he could help them communicate with other creatures from other worlds. Rulers even carried scepters fashioned in his image during dances and processions.

Moreover, Maya artists always had K’awiil doing something or being used to make something happen. They believed that power was something you did, not something you had. Like a bolt of lightning, power was always shifting, always in motion.

An interdependent world

Because of this, the ancient Maya thought that reality was not static but ever-changing. There were no strict boundaries between space and time, the forces of nature or the animate and inanimate worlds.

People walking through knee-deep water on a flooded street with building on either side and electric wires overhead.
Residents wade through a street flooded by Hurricane Helene, in Batabano, Mayabeque province, Cuba, on Sept. 26, 2024. AP Photo/Ramon Espinosa

Everything was malleable and interdependent. Theoretically, anything could become anything else – and everything was potentially a living being. Rulers could ritually turn themselves into gods. Sculptures could be hacked to death. Even natural features such as mountains were believed to be alive.

These ideas – common in pantheist societies – persist today in some communities in the Americas.

They were once mainstream, however, and were a part of K’iche’ religion 1,000 years later, in the time of Huracán. One of the lessons of the Popol Vuh, told during the episode where Huracán clouds human vision, is that the human perception of reality is an illusion.

The illusion is not that different things exist. Rather it is that they exist independent from one another. Huracán, in this sense, damaged himself by damaging his creations.

Hurricane season every year should remind us that human beings are not independent from nature but part of it. And like Hurácan, when we damage nature, we damage ourselves.

James L. Fitzsimmons, Professor of Anthropology, Middlebury

This article is republished from The Conversation under a Creative Commons license. Read the original article.

ooOOoo

It is such a powerful message, that when we damage nature, we damage ourselves.

But I am unaware, no we are both unaware of a solution, and there doesn’t appear to be a government desire to make this the number one topic.

Please, if there is anyone who reads this post and has a more positive message then we would be very keen to hear from you.

Picture Parade Four Hundred and Forty-Nine

A beautiful shot from Southern California.

This photograph was forwarded to me from Dan Gomez, who took it on the morning of last Tuesday.

It was taken in the Coachella Valley and was a morning shot of the sun through the haze caused by the Lion Fire.

Fabulous!

There is no-one else

We are speaking of the universe.

I follow Patrice Ayme and have done for many years. Some of his posts are super-intellectual and those I struggle to understand.

But a post published on September 8th, 2024 was very easy for me, and countless others no doubt, to understand and I have pleasure in republishing it on Learning from Dogs today.

ooOOoo

No Civilizations Out There, We Are It. We Must Rise To The Occasion

September 8, 2024

I doubt that there are civilizations around. We are facing a galaxy devoid of intelligent aliens: little green mats out there, not little green men.

First, we don’t see them. With foreseeable technology (hibernation, nuclear propulsion, compact thermonuclear reactors, bioengineering, AI, quantum computers) we should be able to send very large interstellar spaceships at 1,000 kilometers per second… Thus it would take a millennium to colonize the Centaur tri-star system…. 25,000 years to colonize a 200 light years across ball… And the entire galaxy in ten million years… Wars would only accelerate the expansion. So if there was a galactic civilization, within ten million years it would have spanned the entire galaxy and its presence should be in sight.

Second, life took nearly four billion years to evolve animals. Bacterial life could have been nearly extinguished on Earth many times…. Be it only during the Snowball Earths episodes. A star whizzing by could have launched a thousand large comets. The large planets could have fallen inward.

Third, ultra intelligent life may not be able to have hands or tentacles and thus develop industry. Once intelligent life forms have evolved, say sea lions or parrots, let alone wolves, they may just be sitting ducks for the next disaster which would revert life to the bacterial level, erasing billions of years of evolution.

Fourth, when civilization is launched, it can fail… And not get a second chance (from lack of availability of mines after easy picking during the initial civilization).

Fifth, nuclear powered Earth is special. Earth has plate tectonics, probably from a nuclear reactor at the core, keeps the CO2 just so for a temperate temperature… Water, but not too much. Her large Moon stabilizes her. Earth doesn’t have a weird rotation like Venus (retrograde and slow) or Mars (spectacularly tilting axis). Ian Miller has aluminosilicates considerations on top of that.

So I don’t expect little green men… Besides those sent by the perverse Putin…

Just when we thought we knew of all the stress, here is another one: if we go extinct, the universe loses its soul! We have thus found a new Superior Moral Directive: SUS, Save Unique Soul!

Expect little green mats, not little green men.

Patrice Ayme

ooOOoo

A couple of weeks ago I gave a talk to our local Freethinkers group and called it The Next Ten Years. It began, thus:

This presentation is about the world of the future; of the near future. And the biggest issue, most agree, is the change in the climate. 

The Global Temperature anomaly, as of last year, 2023, is 1.17 Centigrade, 2.11 Fahrenheit, above the long-term average from 1951 to 1980. The 10 most recent years are the warmest years on record.

Antoine de Saint-Exupéry is quoted as saying that ‘a goal without a plan is just a wish.’ So my plan is to show you how we can change, no let me put that more strongly, how we must change in the next ten years. Because our present habits are ruining the world.

The weather conundrum!

We are in an era of unknown weather, across the world!

Niccolò Ubalducci Photographer
Photo by Niccolò Ubalducci

ooOOoo

The climate is changing so fast that we haven’t seen how bad extreme weather could get

Simon H. Lee, University of St Andrews; Hayley J. Fowler, Newcastle University, and Paul Davies, Newcastle University

Published: July 30, 2024

Extreme weather is by definition rare on our planet. Ferocious storms, searing heatwaves and biting cold snaps illustrate what the climate is capable of at its worst. However, since Earth’s climate is rapidly warming, predominantly due to fossil fuel burning, the range of possible weather conditions, including extremes, is changing.

Scientists define “climate” as the distribution of possible weather events observed over a length of time, such as the range of temperatures, rainfall totals or hours of sunshine. From this they construct statistical measures, such as the average (or normal) temperature. Weather varies on several timescales – from seconds to decades – so the longer the period over which the climate is analysed, the more accurately these analyses capture the infinite range of possible configurations of the atmosphere.

Typically, meteorologists and climate scientists use a 30-year period to represent the climate, which is updated every ten years. The most recent climate period is 1991-2020. The difference between each successive 30-year climate period serves as a very literal record of climate change.

This way of thinking about the climate falls short when the climate itself is rapidly changing. Global average temperatures have increased at around 0.2°C per decade over the past 30 years, meaning that the global climate of 1991 was around 0.6°C cooler than that in 2020 (when accounting for other year-to-year fluctuations), and even more so than the present day.

A moving target for climate modellers

If the climate is a range of possible weather events, then this rapid change has two implications. First, it means that part of the distribution of weather events comprising a 30-year climate period occurred in a very different background global climate: for example, northerly winds in the 1990s were much colder than those in the 2020s in north-west Europe, thanks to the Arctic warming nearly four times faster than the global average. Statistics from three decades ago no longer represent what is possible in the present day.

Second, the rapidly changing climate means we have not necessarily experienced the extremes that modern-day atmospheric and oceanic warmth can produce. In a stable climate, scientists would have multiple decades for the atmosphere to get into its various configurations and drive extreme events, such as heatwaves, floods or droughts. We could then use these observations to build up an understanding of what the climate is capable of. But in our rapidly changing climate, we effectively have only a few years – not enough to experience everything the climate has to offer.

Extreme weather events require what meteorologists might call a “perfect storm”. For example, extreme heat in the UK typically requires the northward movement of an air mass from Africa combined with clear skies, dry soils and a stable atmosphere to prevent thunderstorms forming which tend to dissipate heat.

Such “perfect” conditions are intrinsically unlikely, and many years can pass without them occurring – all while the climate continues to change in the background. Based on an understanding of observations alone, this can leave us woefully underprepared for what the climate can now do, should the right weather conditions all come together at once.

Startling recent examples include the extreme heatwave in the Pacific north-west of North America in 2021, in which temperatures exceeded the previous Canadian record maximum by 4.6°C. Another is the occurrence of 40°C in the UK in summer 2022, which exceeded the previous UK record maximum set only three years earlier by 1.6°C. This is part of the reason why the true impact of a fixed amount of global warming is only evident after several decades, but of course – since the climate is changing rapidly – we cannot use this method anymore.

Playing with fire

To better understand these extremes, scientists can use ensembles: many runs of the same weather or climate model that each slightly differ to show a range of plausible outcomes. Ensembles are routinely used in weather prediction, but can also be used to assess extreme events which could happen even if they do not actually happen at the time.

When 40°C first appeared in ensemble forecasts for the UK before the July 2022 heatwave, it revealed the kind of extreme weather that is possible in the current climate. Even if it had not come to fruition, its mere appearance in the models showed that the previously unthinkable was now possible. In the event, several naturally occurring atmospheric factors combined with background climate warming to generate the record-shattering heat on July 19 that year.

The highest observed temperature each year in the UK, from 1900 to 2023

A graph showing the highest observed temperature in the UK between 1900 and 2023.
The hottest days are getting hotter in the UK. Met Office/Kendon et al. 2024

Later in summer 2022, after the first occurrence of 40°C, some ensemble weather forecasts for the UK showed a situation in which 40°C could be reached on multiple consecutive days. This would have posed an unprecedented threat to public health and infrastructure in the UK. Unlike the previous month, this event did not come to pass, and was quickly forgotten – but it shouldn’t have been.

It is not certain whether these model simulations correctly represent the processes involved in producing extreme heat. Even so, we must heed the warning signs.

Despite a record-warm planet, summer 2024 in the UK has been relatively cool so far. The past two years have seen global temperatures far above anything previously observed, and so potential extremes have probably shifted even further from what we have so far experienced.

Just as was the case in August 2022, we’ve got away with it for now – but we might not be so lucky next time.

Simon H. Lee, Lecturer in Atmospheric Science, University of St Andrews; Hayley J. Fowler, Professor of Climate Change Impacts, Newcastle University, and Paul Davies, Chief Meteorologist, Met Office and Visiting Professor, Newcastle University

This article is republished from The Conversation under a Creative Commons license. Read the original article.

ooOOoo

That last sentence says it all: “Just as was the case in August 2022, we’ve got away with it for now – but we might not be so lucky next time.”

I am giving a talk, The Next Ten Years, next Saturday to our local Freethinkers group in Grants Pass. Close to the start of the presentation I say: “The Global Temperature anomaly, as of last year, 2023, is 1.17 C, 2.11 F, above the long-term average from 1951 to 1980. The 10 most recent years are the warmest years on record.

Finally, I am getting on in age and part of me wants to die, hopefully naturally, before more climate extremes are reached, but then another part of me would like to experience it!

Wildfire prevention

This is a precarious time of the year!

We live just outside Merlin in Southern Oregon. We have 13 acres of which roughly half is wooded. With the year-on-year warming wildfires are never far from our minds during our Summer. Here’s a part of a message from OPB.

What’s happening

High temperatures are in the forecast along the Interstate 5 corridor, the Willamette Valley and in Central and Eastern Oregon. More than a quarter million acres across multiple counties in Eastern Oregon are ablaze with wildfires, and that could mean smoke and haze, especially in Central and northeastern Oregon.

A view of the southern portion of the Lone Rock Fire in north-central Oregon on Wednesday, July 17, 2024.
A view of the southern portion of the Lone Rock Fire in north-central Oregon on Wednesday, July 17, 2024.Courtesy InciWeb 

Hot weather persists

The National Weather Service is anticipating a hot weekend across much of Oregon and Southwest Washington. The agency on Friday issued a heat advisory along the Interstate 5 corridor from Battle Ground, Washington to Cottage Grove, Oregon from 11 a.m. to 11 p.m. Saturday. Temperatures could reach the mid-90s.

From central Oregon east towards Burns a heat advisory is in place from 11 a.m. Saturday to 11 p.m. Monday. Harney County could see temperatures over 100 degrees over the weekend.

Which neatly serves as an introduction to an article from The Conversation about protecting one’s home.

ooOOoo

How to protect your home from wildfires – here’s what fire prevention experts say is most important

Bryce Young, University of Montana and Chris Moran, University of Montana

Extreme heat has already made 2024 a busy wildfire year. More acres had burned by mid-July than in all of 2023, and several communities had lost homes to wildfires.

As fire season intensifies across the West, there are steps homeowners can take to make their homes less vulnerable to burning and increase the likelihood that firefighters can protect their property in the event of a wildfire.

We research wildfire risk to homes and communities. Here’s what decades of research suggest homeowners in high-fire-risk areas can do to protect their properties.

Two photos show the house with the fire behind it and after the fire, with burned land around it but the house untouched.
This house near Cle Elum, Wash., survived a 2012 wildfire because of the defensible space around the structure, including a lack of trees and brush close to the house, according to state officials. AP Photo/Elaine Thompson

Small improvements make big differences

A structure’s flammability depends on both the materials that were used to build it and the design of the building. In general, the vulnerability of a house is determined by its weakest point.

The roof, windows, siding and vents are all vulnerable points to pay attention to.

Roof: The roof provides a landing pad where airborne embers can accumulate like snowflakes. Roofs with lots of valleys can collect pine needles and leaves, which can be ignited by flying embers. This is why it’s important for the roof itself to be made of Class A non-flammable material like clay tiles or asphalt shingles, and why roof maintenance, including cleaning gutters, is important. Embers can easily find their way under peeling shingles, through gaps of clay tiles, or into gutters where pine needles and leaves can accumulate.

Windows: If windows are exposed to heat, they can shatter and allow fire inside the home, where curtains can easily ignite. Even double-paned windows can be shattered by the heat of a burning shed 30 feet away, unless the window glass is tempered, making it stronger. Fire-resistant shutters made of metal, if closed before a fire arrives, can offer additional protection. https://www.youtube.com/embed/HjA9yLP1icg?wmode=transparent&start=0 A life-size test with blowing embers at IBHS’s fire lab shows ways homes are at risk form a nearby fire.

Siding: Materials like stucco are non-flammable, while cedar shake siding will burn. Your exterior siding should be non-flammable, but the siding is only as strong as its weakest point. If there are holes in the siding, plug them with caulk to prevent embers from reaching the wooden frame in your walls. Ideally, there will be a 6- to 12-inch concrete foundation between the ground and the bottom of your siding material.

Vents: Reducing risk from vents is easy and affordable and can drastically reduce the flammability of your home. Make sure that one-eighth inch or finer metal mesh is installed over all vents to keep embers out of your attic and your home’s interior.

Controlling your home ignition zone

A home’s vulnerability also depends on the area around it, referred to as the home ignition zone.

The risk in your home ignition zone depends on things such as the slope of your land and the ecosystem surrounding your home. Here are a few guidelines the National Fire Protection Association recommends, both to reduce the chance of flames reaching your home and make it easier for firefighters to defend it.

Zone 1 – Within 5 feet

From the home’s exterior to 5 feet away, you want to prevent flames from coming in contact with windows, siding, vents and eaves. The gold standard is to have only non-flammable material in Zone 1.

The most common risks are having flammable mulch, plants, firewood, lawn furniture, decks and fences. These items have been a primary reason homes burned in many wildfires, including the 2018 Camp Fire that destroyed much of Paradise, California, and the 2012 Waldo Canyon Fire near Colorado Springs, Colorado.

An illustration of a house with rings at different distances around it and advice for each ring.
Fire protection guidelines take into consideration the surrounding ecosystem. Here some examples based on the National Fire Protection Association’s guidelines. Bryce Young, CC BY

Replacing mulch with gravel or pavers and having only short, sparse plants that don’t touch the house can help reduce the risk.

Wooden decks and fences can burn even if they are well-maintained. Replacing them with non-flammable materials or installing a thin sheet of metal on the house where the siding touches a wooden deck or fence can help protect the home. Mesh screens can prevent the accumulation of debris and embers under the deck.

Zone 2 – 5 to 30 feet away

In the next ring, between 5 and 30 feet from the home, the lawn should be green and short. This is Zone 2.

Be sure to rake up pine needles and leaves and take care to prune the lowest tree branches at least 6 feet high.

There should be about 18 feet of space between trees on a flat slope, and the spacing should increase with slope because steeper terrain drives faster, more intense fires. Walks, pathways, patios, decks and firewood can be kept in this zone.

Zone 3 – 30 to 100 feet away

Beyond Zone 2 and out to about 100 feet from the home is Zone 3. In this area, be sure to give sheds and propane tanks their own defensible space, just like around the house, and prune all low branches to 6 feet.

You can contact your local emergency management office or community wildfire nonprofit to learn more about grant funding that can offset the costs of pruning and removing trees on a forested property.
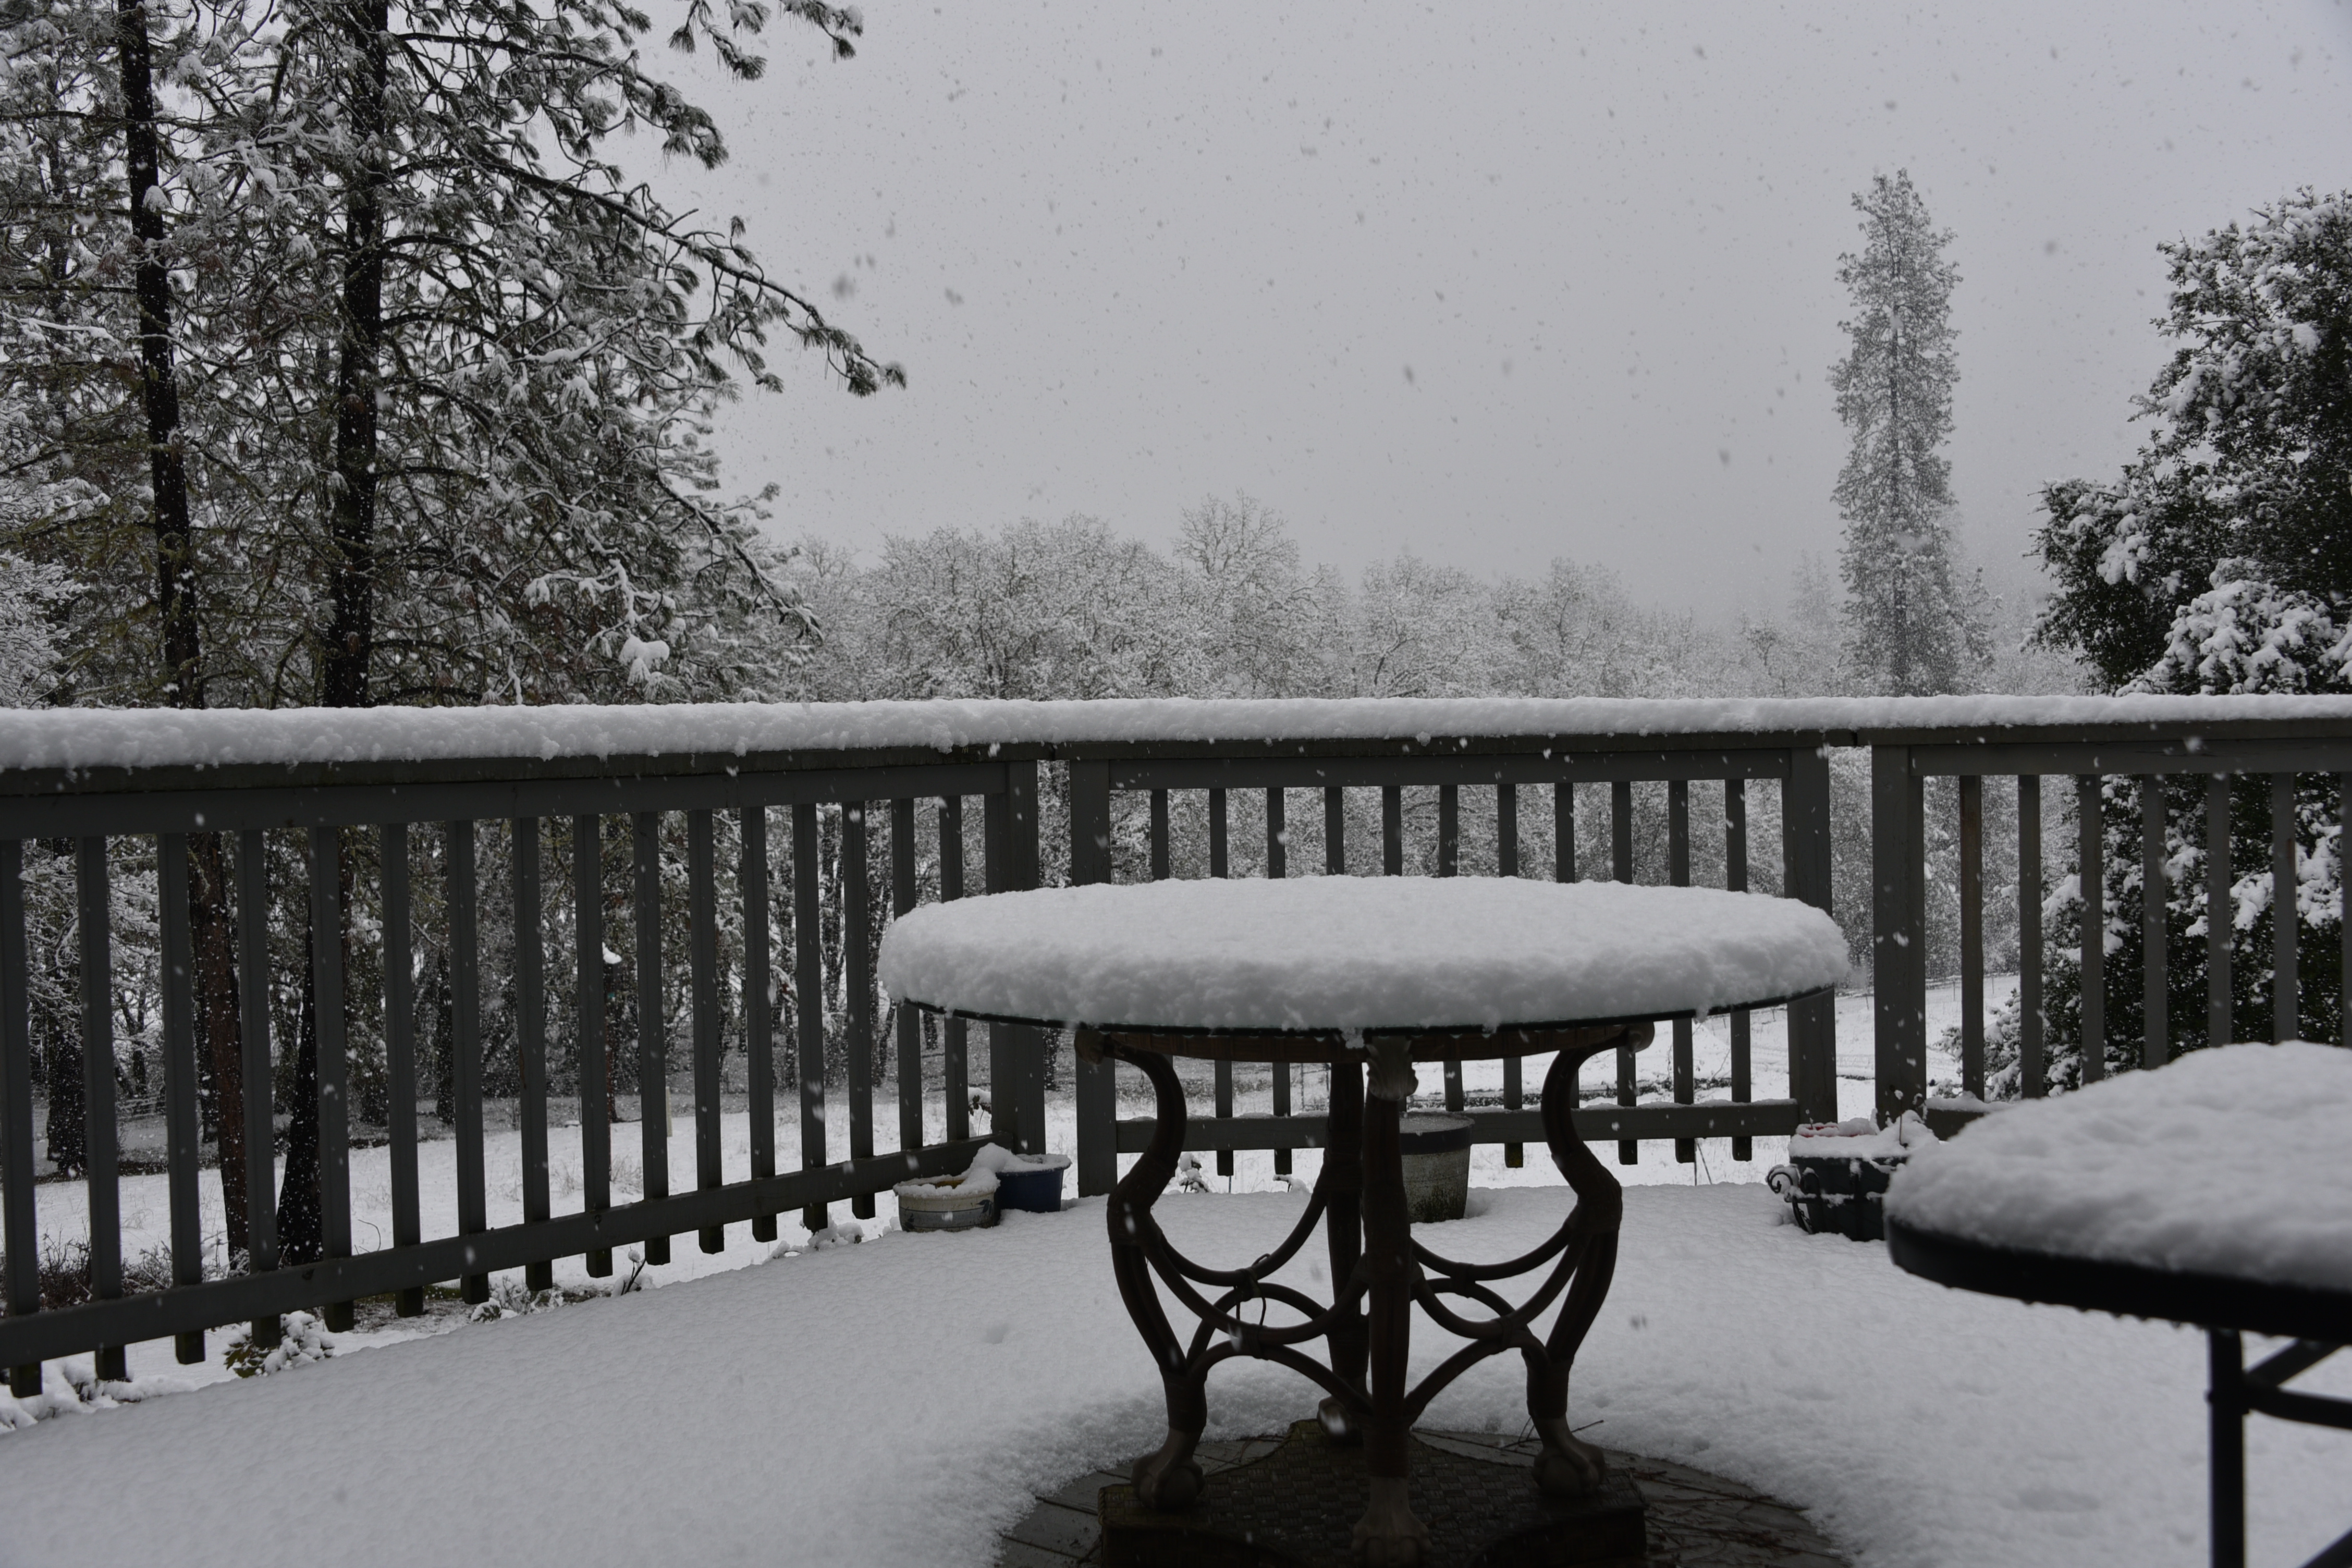
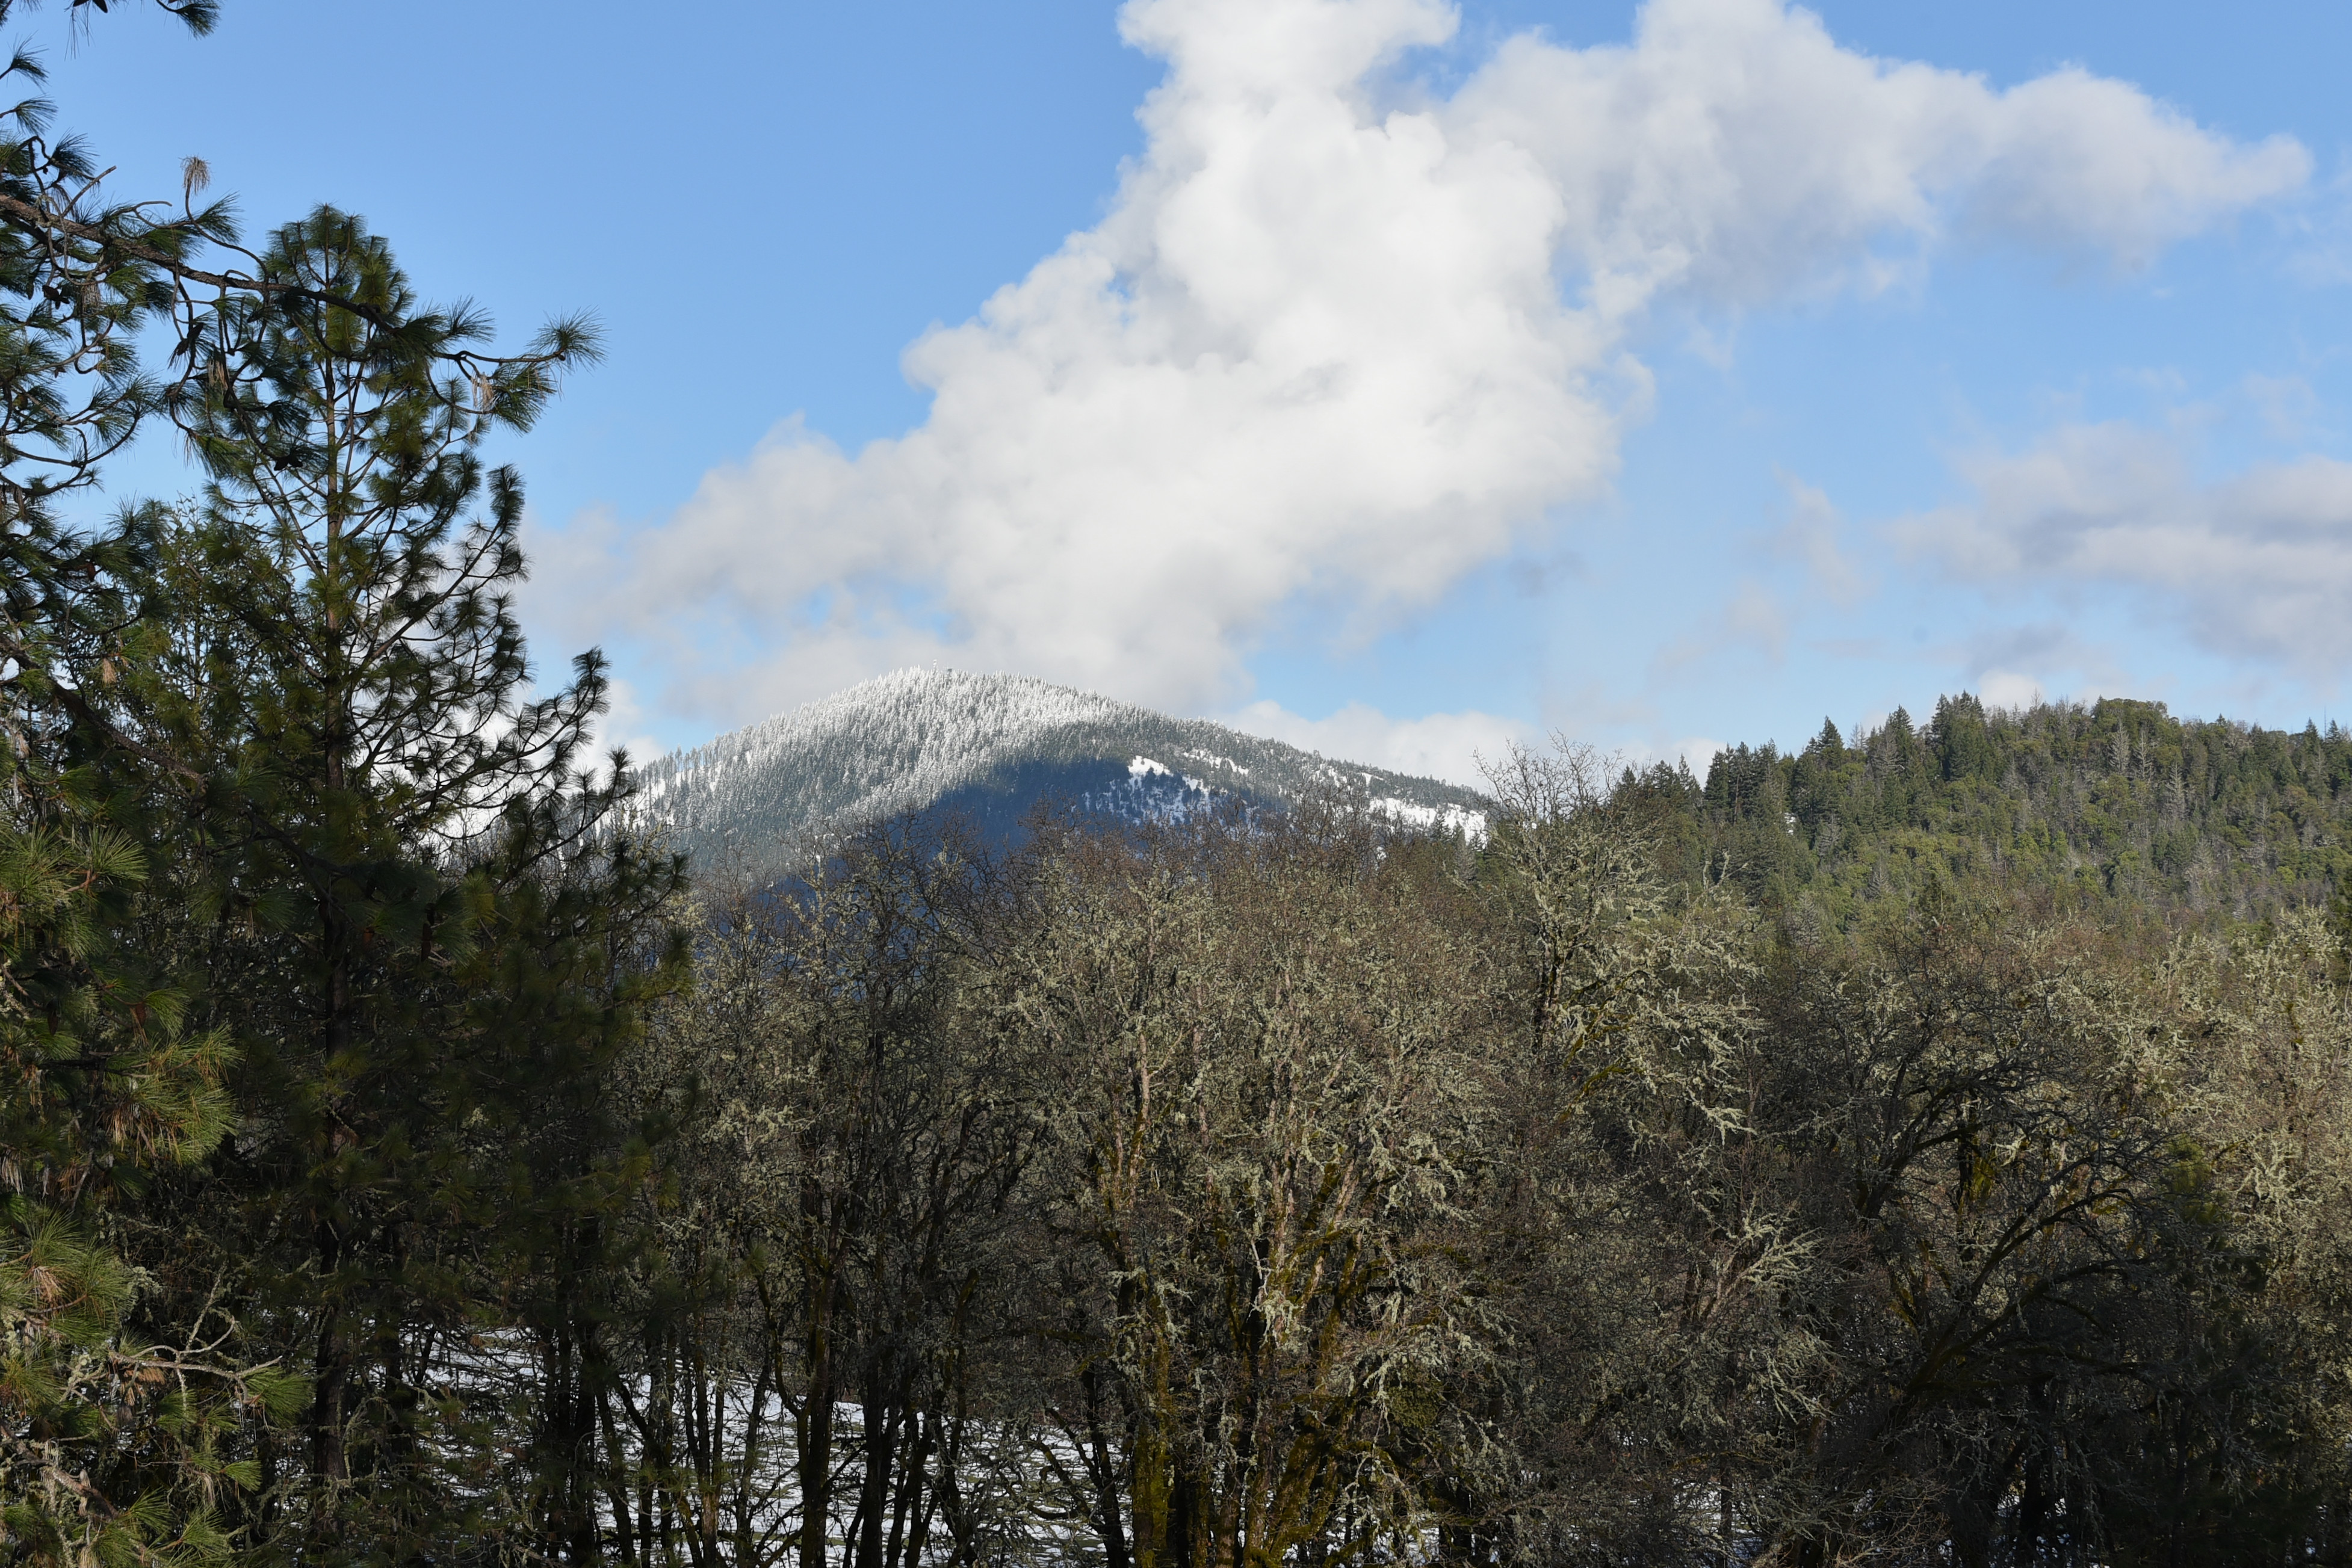
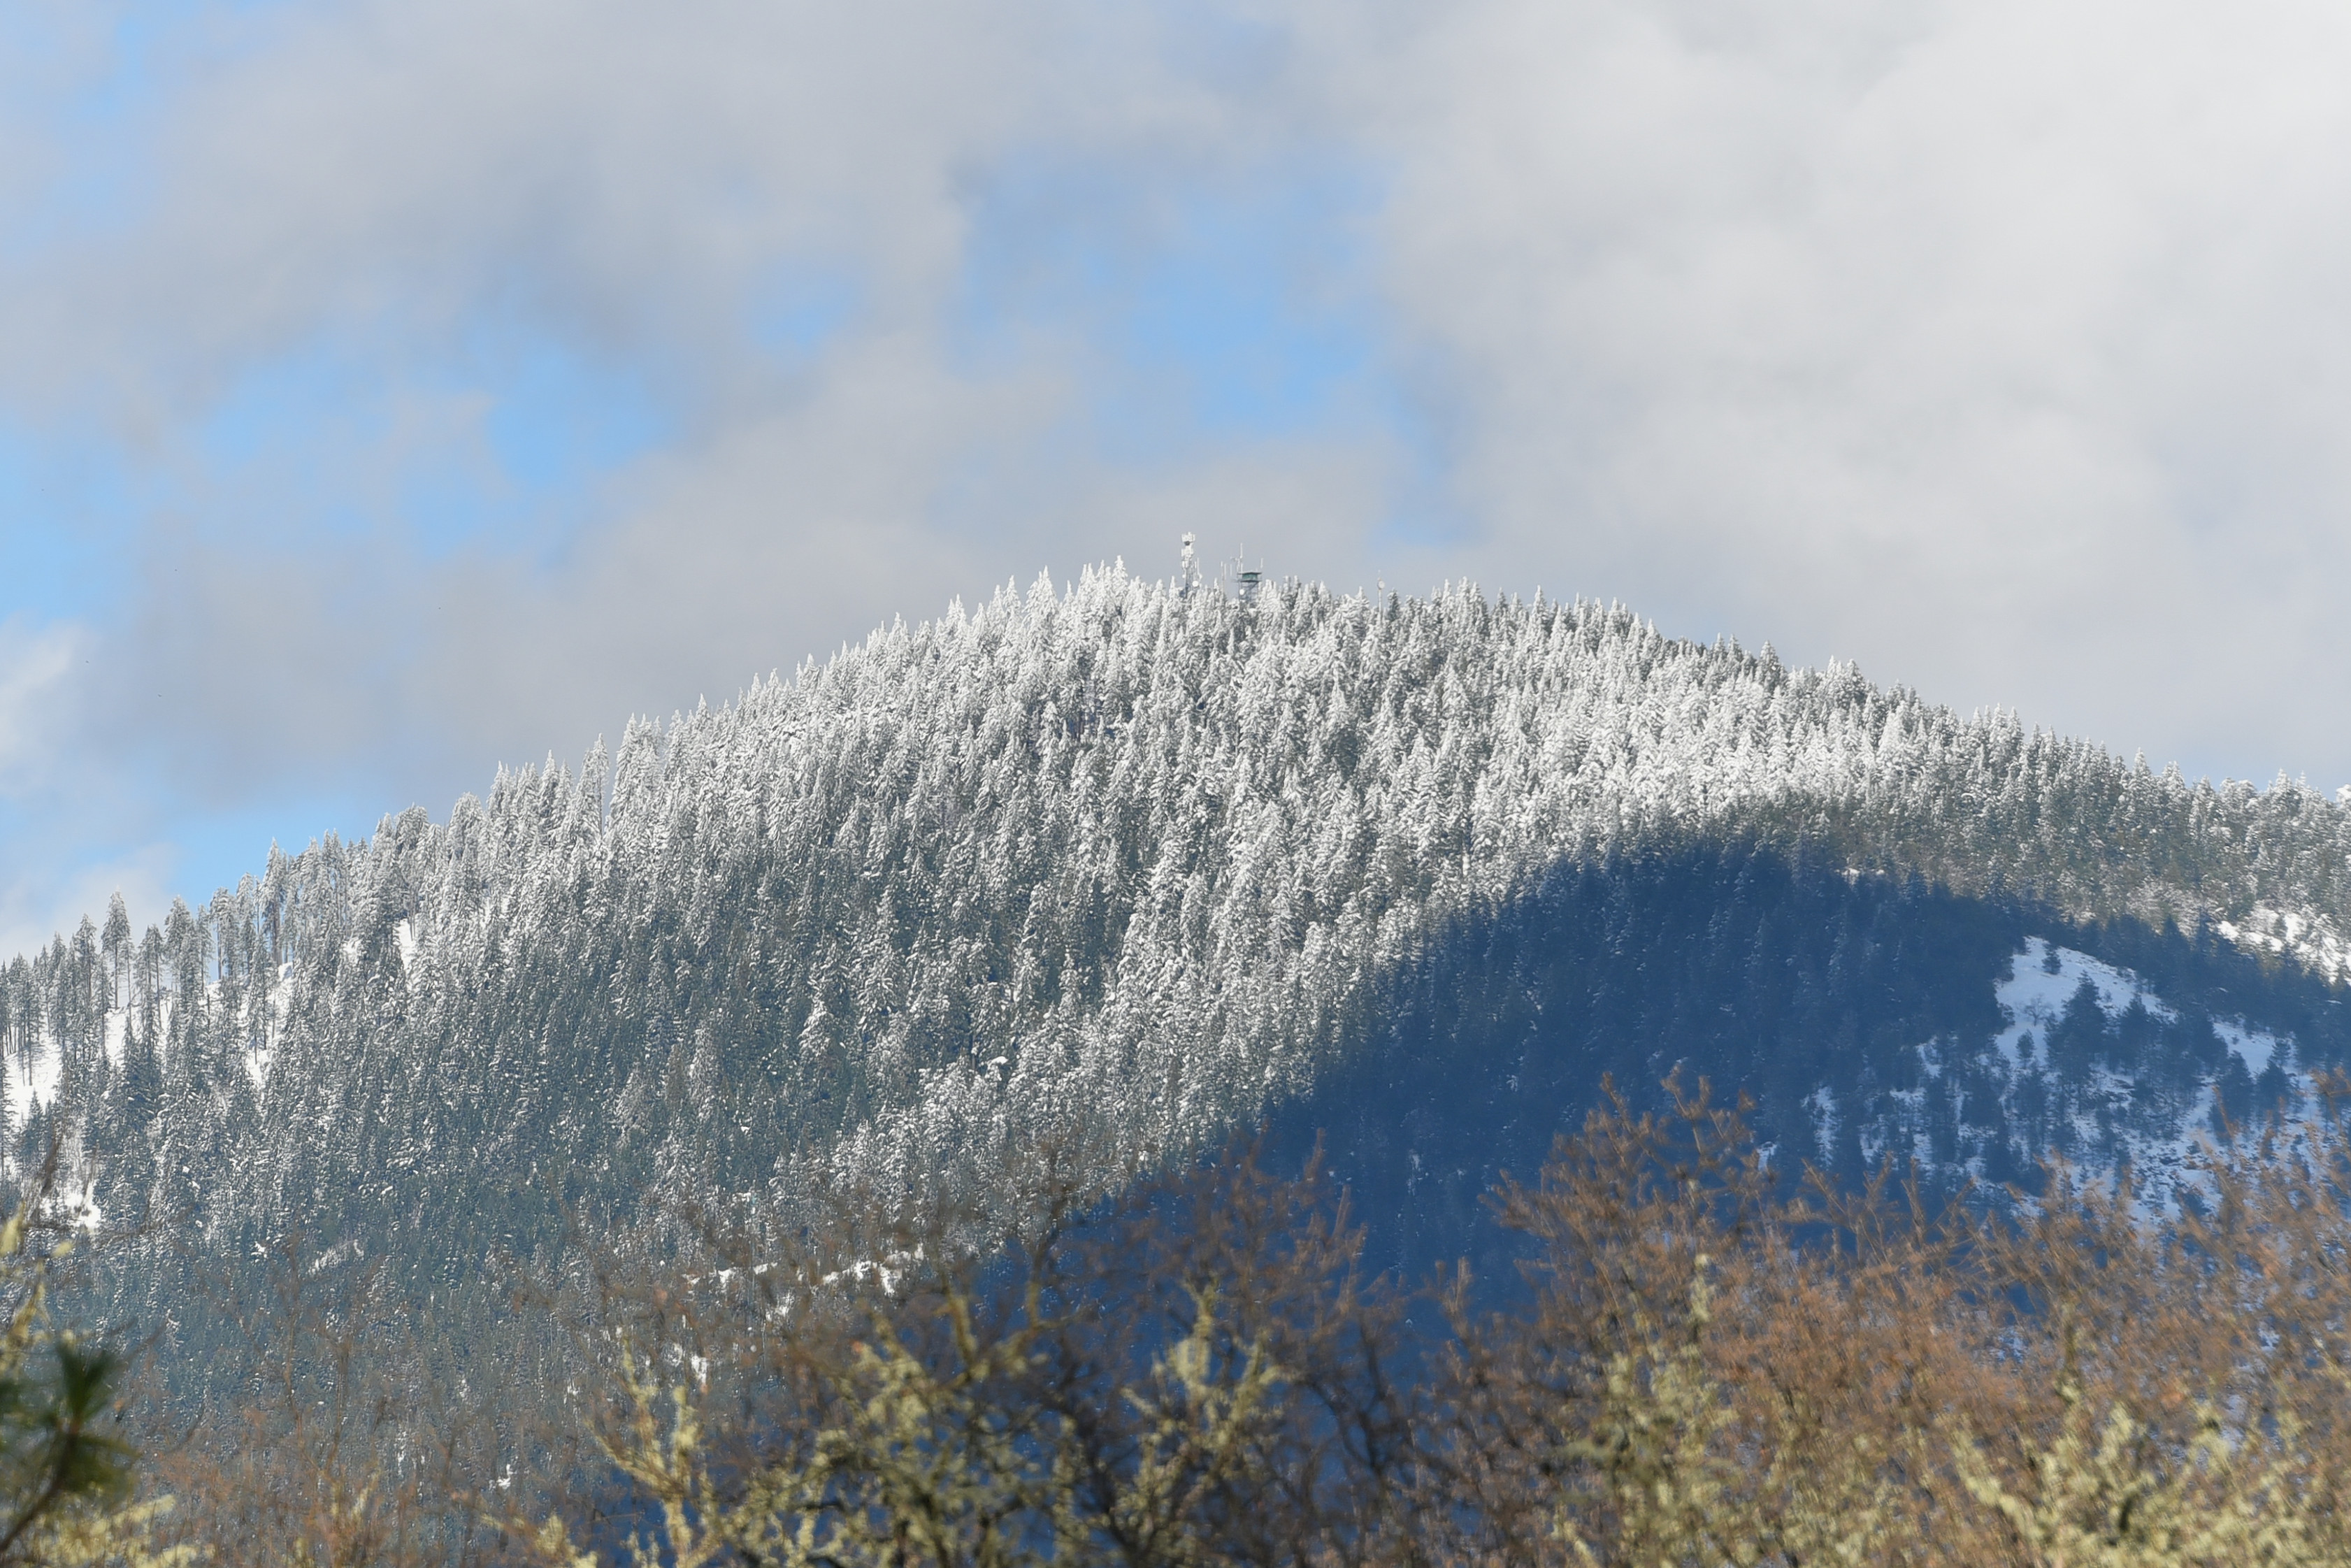
Beyond 100 feet may extend past your property boundary, but the adjacent house can still be fuel for a wildfire. That’s why it’s smart to plan with your neighbors as you’re reinforcing your own home. Once one house catches fire, house-to-house fire spread is facilitated by closer distances between buildings.

Be prepared

While most U.S. government spending aims to mitigate wildfire hazard on national forests, it is up to residents and communities themselves to reduce their vulnerability to a wildfire disaster.

Following the guidelines required by your community or state and those outlined above can help. Communities can also take steps to reduce fire risk and make fires easier to control by developing a community wildfire protection plan, exploring their wildfire risk, and adopting wildfire-specific building codes.

As the nation rolls into fire season, make sure your property is prepared. And when the call to evacuate comes, know where to go and get the heck out.

Bryce Young, Graduate Student Researcher, Fire Center, University of Montana and Chris Moran, Post-doctoral Researcher, Fire Center, University of Montana

This article is republished from The Conversation under a Creative Commons license. Read the original article.

ooOOoo

Where we live is beautiful and earlier this year we had a great deal of rain. But the summers are dry; that is a function of the climate in this part of the world. So for July so far we have had no rain and that is normal. Also no rain in July in 2023.

The three zones, as described earlier in this post, are very helpful.

This is home!

Reflections on Oregon.

Or more precisely Southern Oregon.

We live in a beautiful State.

Roughly 100 miles North-East of us is Crater Lake.

Photo by Anukrati Omar on Unsplash

It was formed when this former volcano, “which collapsed on itself during an eruption just 7,700 years ago and slowly filled with melted snow, now stands as Oregon’s only national park.”

At over 2,000 feet deep it is the deepest lake in the United States of America.

There is a website, 16 Reasons Why Oregon is the Best State in the Country, and Jean and I believe it. Do visit this web page.

Oregon has acres and acres of forest and wild lands.

Photo by Dan Meyers on Unsplash

Photo by Moss and Fog on Unsplash

Oregon has many truly wild places. Here is a photograph of one of Oregon’s famous waterfalls.

Photo by Chris Briggs on Unsplash

Here is a photo of the wild coast and the ocean.

Photo by KAL VISUALS on Unsplash

Photo by Jordan Steranka on Unsplash

As was said at the start, Jean and I live in a very beautiful part of America.

Plus the people are incredibly friendly.

A post on Heat

Not the first and I’m sure it won’t be the last on this topic!

We are experiencing the first week of Summer’s heat.

Where it is going, temperature-wise, who knows but the consensus is that it is becoming warmer year on year.

So this seemed like a great post to republish. It was on The Conversation.

ooOOoo

Heat index warnings can save lives on dangerously hot days − if people understand what they mean

The sticky combination of heat and high humidity can be more than uncomfortable – it can be deadly. Mario Tama/Getty Images

Micki Olson, University at Albany, State University of New York

You’ve probably heard people say, “It’s not the heat, it’s the humidity.” There’s a lot of truth to that phrase, and it’s important to understand it as summer temperatures rise.

Humidity doesn’t just make you feel sticky and uncomfortable – it also creates extra dangerous conditions on hot days. Together, too much heat and humidity can make you sick. And in severe cases, it can cause your body to shut down.

Meteorologists talk about the risk of heat and humidity using the heat index, but it can be confusing.

I’m a risk communication researcher. Here’s what you need to know about the heat index and some better ways meteorologists can talk about the risks of extreme heat.

A construction worker in reflective gear holds a jacket over his head against the sun.
Outdoor workers can be at high risk of heat illnesses. Robert Gauthier/Los Angeles Times via Getty Images

What is the heat index, and how is it measured?

Heat index is the combination of the actual air temperature and relative humidity:

  • Air temperature is how hot or cold the air is, which depends on factors such as the time of day, season of the year and local weather conditions. It is what your thermometer reads in degrees Celsius or Fahrenheit.
  • Relative humidity compares how much water vapor is in the air with how much water vapor the air could hold at that temperature. It’s expressed as a percentage.

The heat index tells you what it “feels like” outside when you factor in the humidity. For example, if it’s 98 degrees Fahrenheit (36.7 Celsius) with 55% relative humidity, it might feel more like a scorching 117 F (47.2 C).
A chart with a grid showing heat and humidity risks.
NOAA’s heat index chart shows how heat and humidity combine for dangerous temperatures. NOAA

But there’s a catch: Heat index is measured in shady conditions to prevent the sun’s angle from affecting its calculation. This means if you’re in direct sunlight, it will feel even hotter.

Apparent temperature, alerts and wet bulb

“Apparent temperature” is another term you might hear this summer.

Apparent temperature is the “feels like” temperature. It considers not only temperature and humidity but also wind speed. This means it can tell us both the heat index and wind chill – or the combination of the temperature and wind speed. When conditions are humid, it feels hotter, and when it’s windy, it feels colder.

We found that apparent temperature is even less well understood than the heat index, possibly due to the word apparent having various interpretations.

There are a few other ways you may hear meteorologists talk about heat.

Wet bulb globe temperature considers temperature, humidity, wind and sunlight. It’s especially useful for those who spend time outdoors, such as workers and athletes, because it reflects conditions in direct sunlight.

HeatRisk is a new tool developed by the National Weather Service that uses colors and numbers to indicate heat risks for various groups. More research is needed, however, to know whether this type of information helps people make decisions.

In many places, the National Weather Service also issues alerts such as excessive heat watches, warnings and advisories.

The risk is getting lost in translation

Knowing about heat and humidity is important, but my colleagues and I have found that the term heat index is not well understood.

We recently conducted 16 focus groups across the United States, including areas with dry heat, like Phoenix, and more humid areas, like Houston. Many of the people involved didn’t know what the heat index was. Some confused it with the actual air temperature. Most also didn’t understand what the alerts meant, how serious they were or when they should protect themselves.

In our discussions with these groups, we found that meteorologists could get across the risk more clearly if, instead of using terms like heat index, they focus on explaining what it feels like outside and why those conditions are dangerous.

Watches, warnings and advisories could be improved by telling people what temperatures to expect, when and steps they can take to stay safe.

A woman holds a baby at an open window with a fan blowing in.
Clear warnings can help residents understand their risk and protect themselves, which is especially important for small children and older adults, who are at greater risk of heat illness. Jason Armond/Los Angeles Times via Getty Images

Climate change is exacerbating heat risks by making extreme heat more common, intense and long-lasting. This means clear communication is necessary to help people understand their risk and how they can protect themselves.

What you can do to protect yourself

With both hot and humid conditions, extra precautions are necessary to protect your health. When you get hot, you sweat. When sweat evaporates, this helps the body cool down. But humidity prevents the sweat from evaporating. If sweat cannot evaporate, the body has trouble lowering or regulating its temperature.

Although everyone is at risk of health issues in high heat, people over 65, pregnant women, infants and young children can have trouble cooling their bodies down or may run a higher risk of becoming dehydrated. Certain health conditions or medications can also increase a person’s risk of heat-related illness, so it’s important to talk to your doctor about your risk.

Heat illnesses, such as heat exhaustion and heat stroke, are preventable if you take the right steps. The U.S. Centers for Disease Control and Prevention focuses on staying cool, hydrated and informed.

  • Stay cool: Use air conditioning in your home, or spend time in air-conditioned spaces, such as a shopping mall or public library. Limit or reschedule your exercise and other outdoor plans that occur in the middle of the day when it is hottest.
  • Stay hydrated: Drink more water than you might otherwise, even if you don’t feel thirsty, so your body can regulate its temperature by sweating. But avoid sugary drinks, caffeine or drinks with alcohol, because these can cause you to become dehydrated.
  • Stay informed: Know the signs of heat illness and symptoms that can occur, such as dizziness, weakness, thirst, heavy sweating and nausea. Know what to do and when to get help, because heat illnesses can be deadly.
Heat exaustion includes dizziness, thirst, heavy sweating, nausea and weakness. Move to cooler area, loosen clothing, sip cool water and get medical help if no improvement. If heat stroke, including confusion, dizziness and unconsciousness, also call 911.
The difference between heat exhaustion and heat stroke and the CDC’s advice on how to respond. NOAA, CDC

Micki Olson, Senior Researcher in Emergency and Risk Communication, University at Albany, State University of New York

This article is republished from The Conversation under a Creative Commons license. Read the original article.

ooOOoo

That last diagram on staying cool, staying hydrated, and staying informed is one element in me choosing this article for publication. Further, if one looks up the website for the Centers for Disease Control and Prevention then immediately one comes across:

Stay cool indoors.Stay in an air-conditioned place as much as possible. If your home does not have air conditioning, go to the shopping mall or public library—even a few hours spent in air conditioning can help your body stay cooler when you go back into the heat.

Please take care!