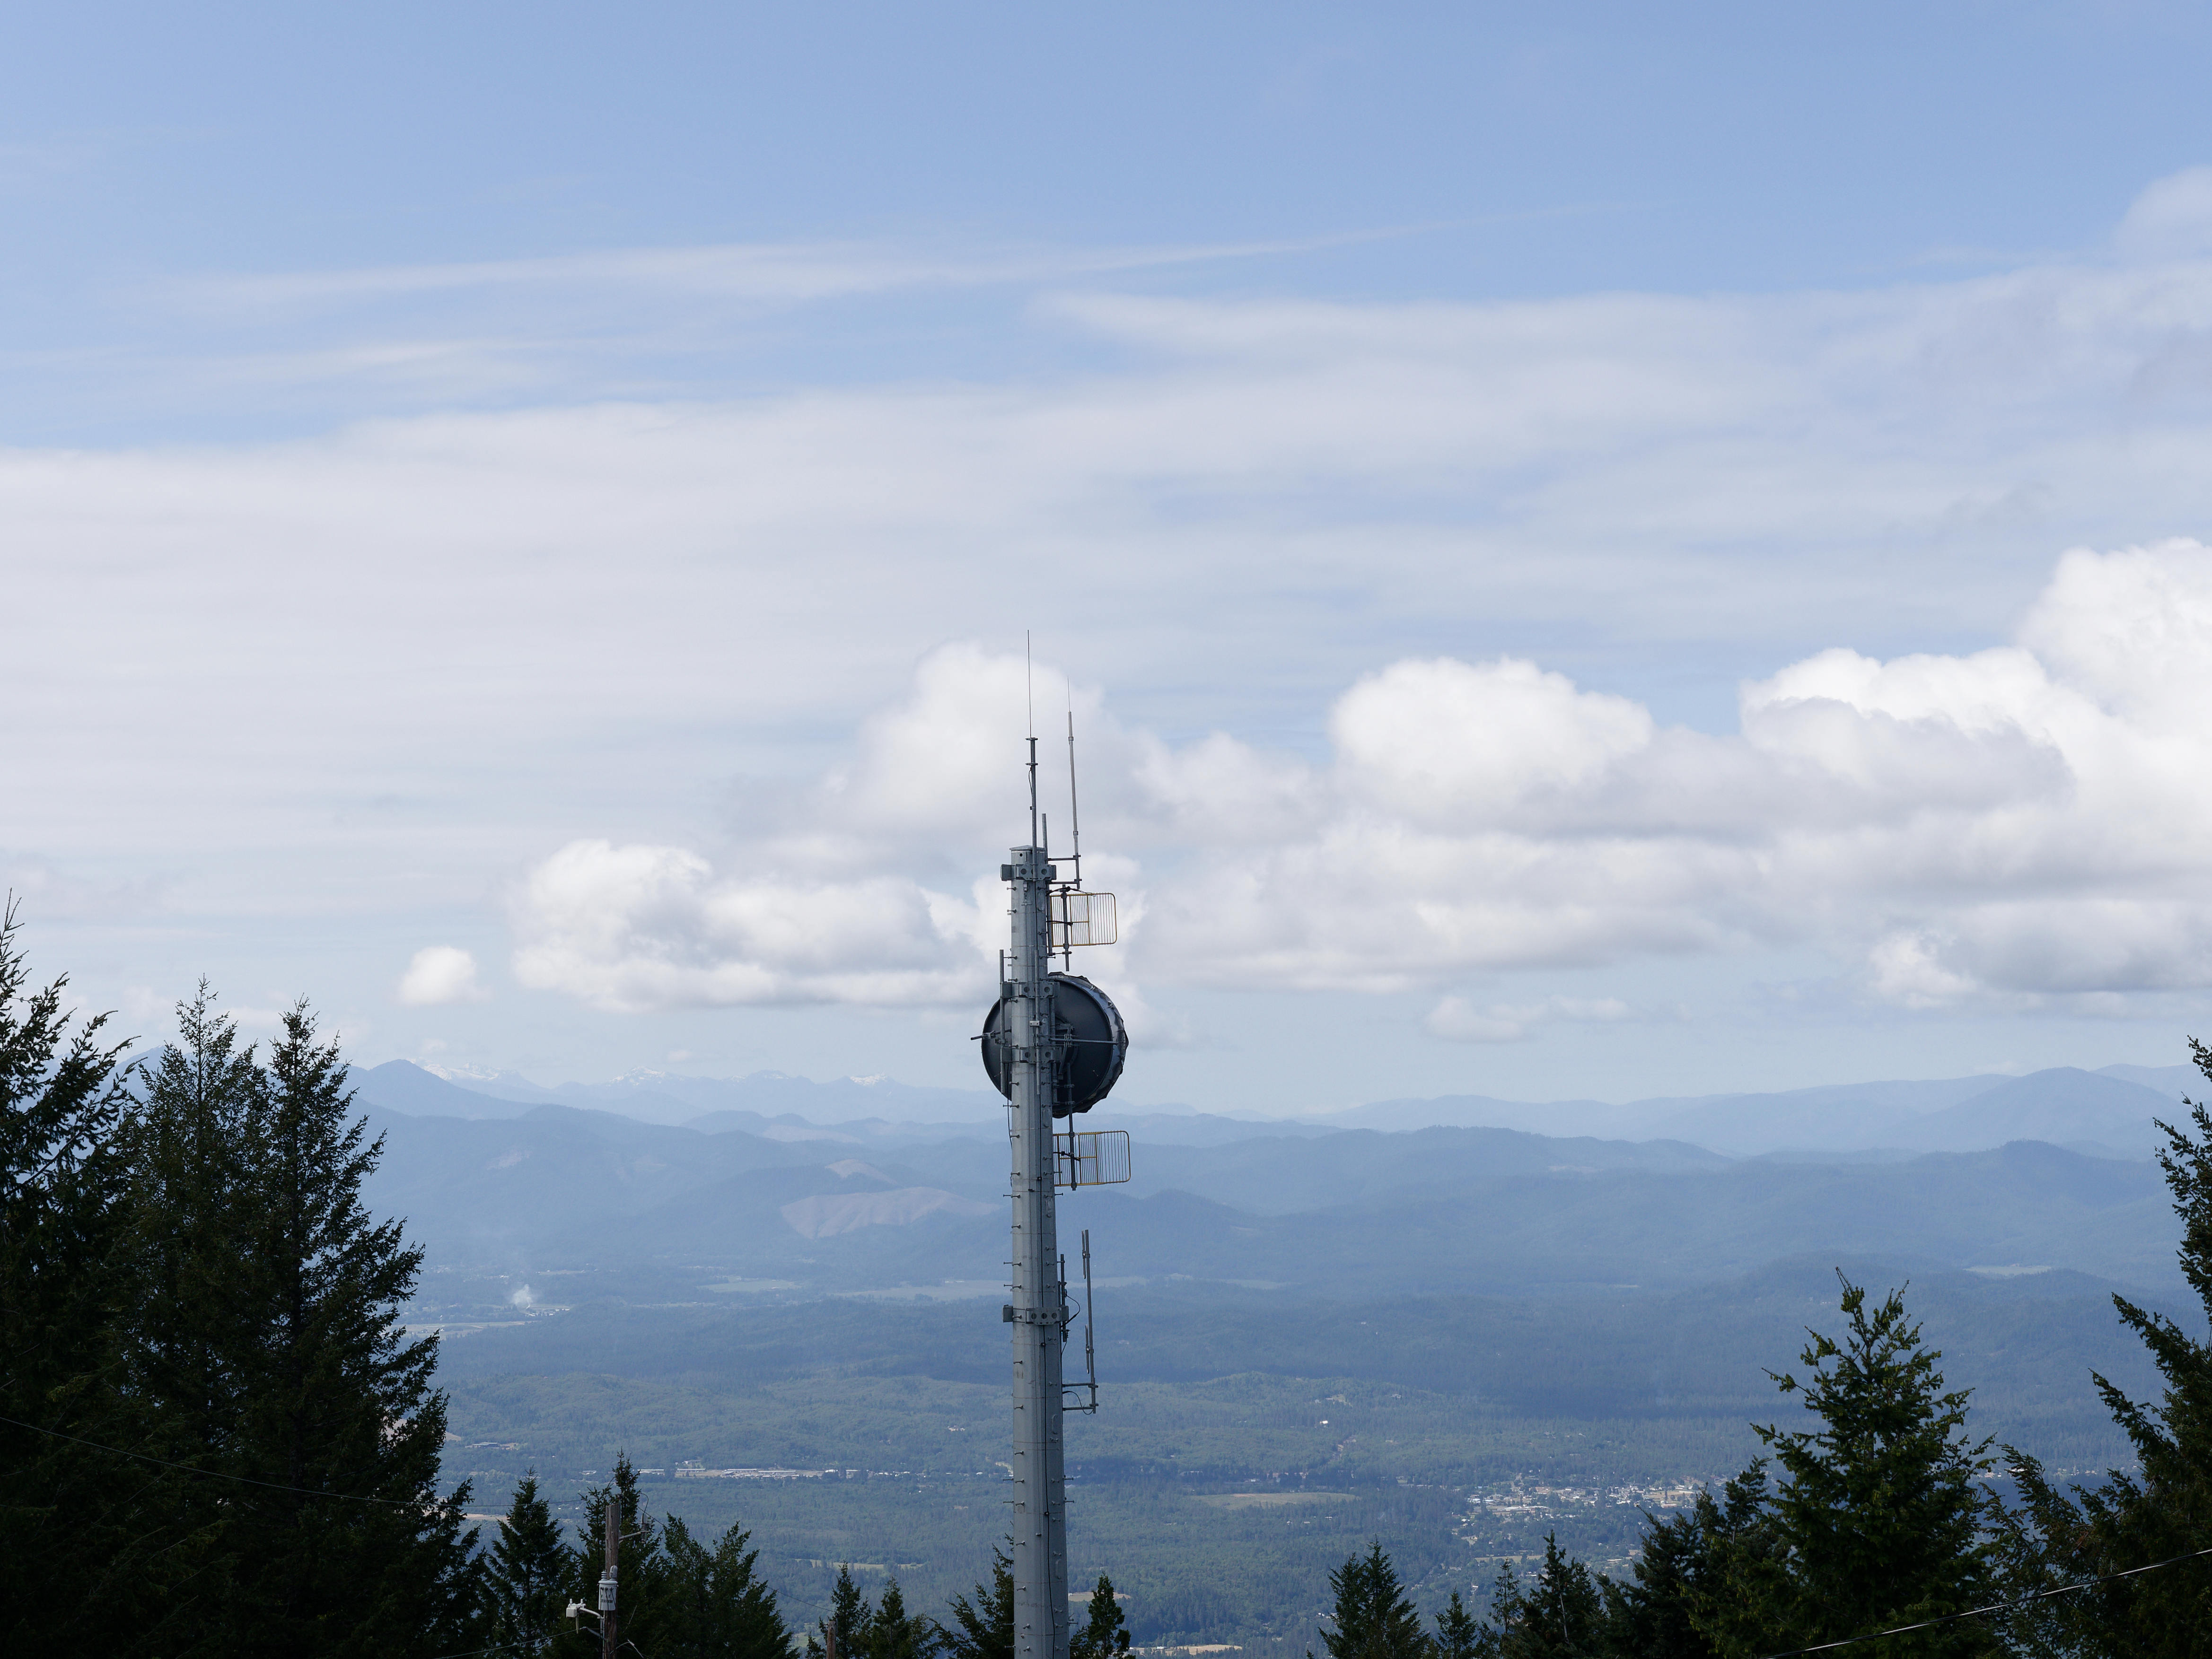
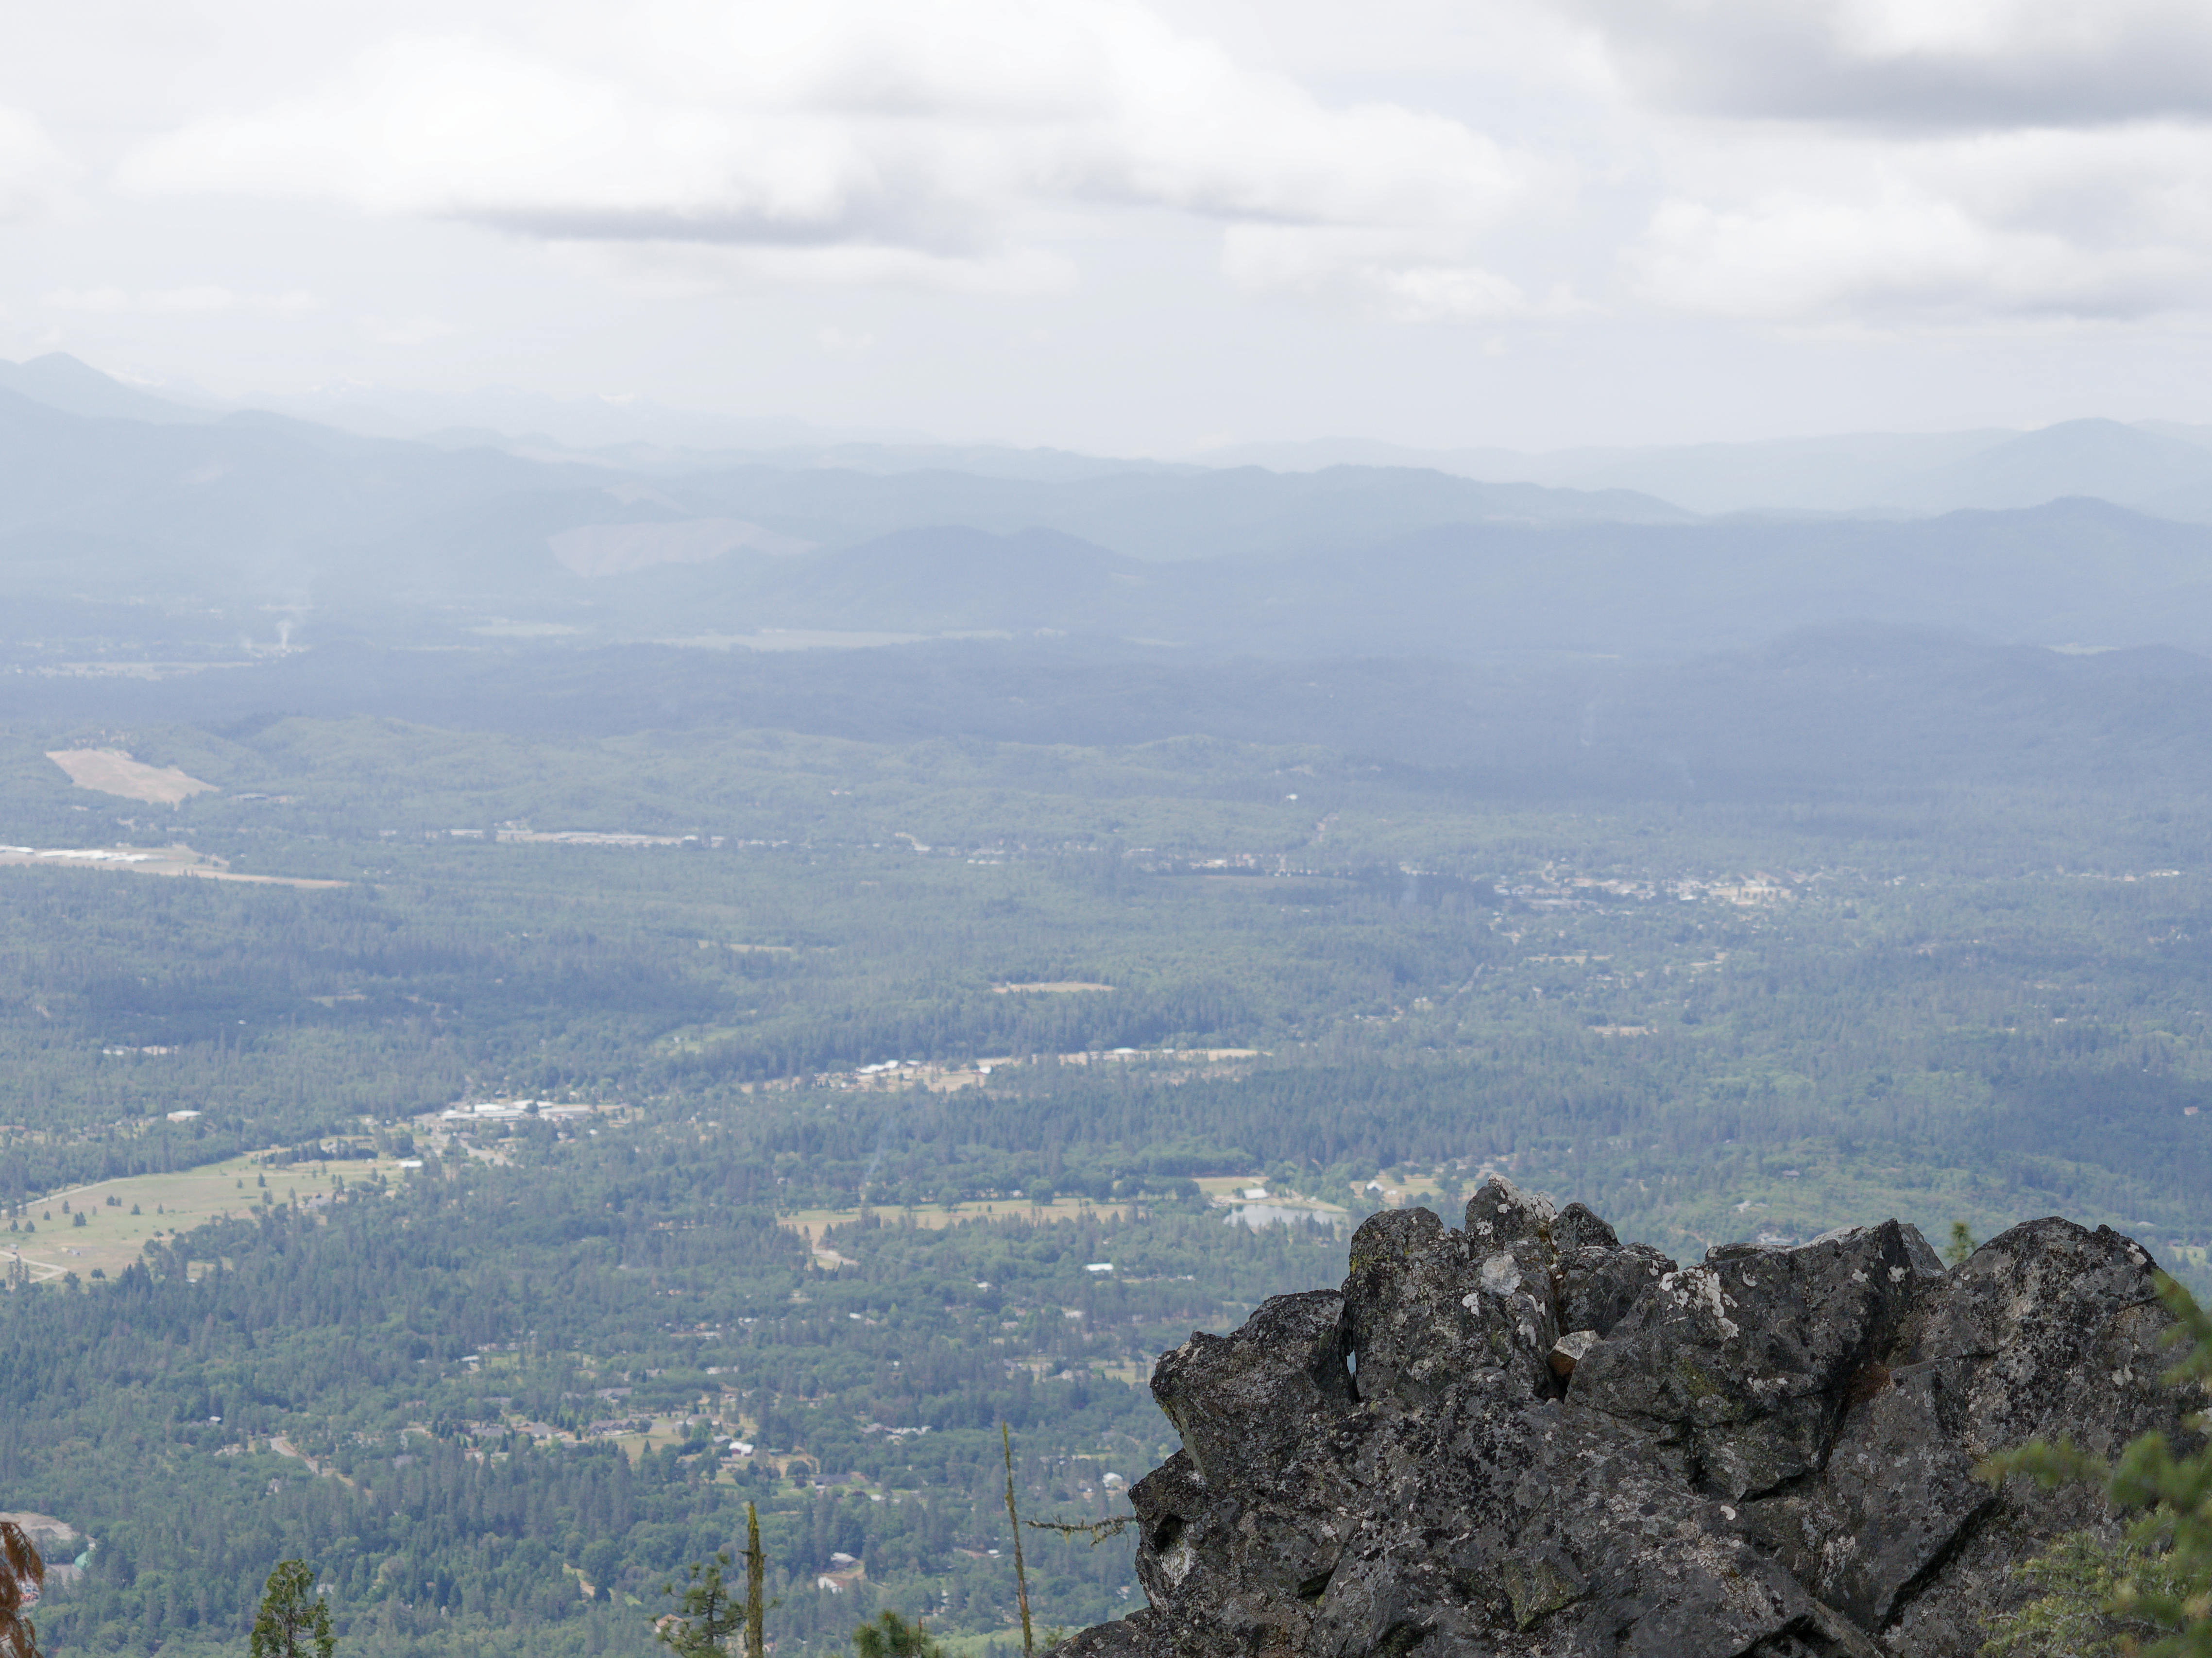
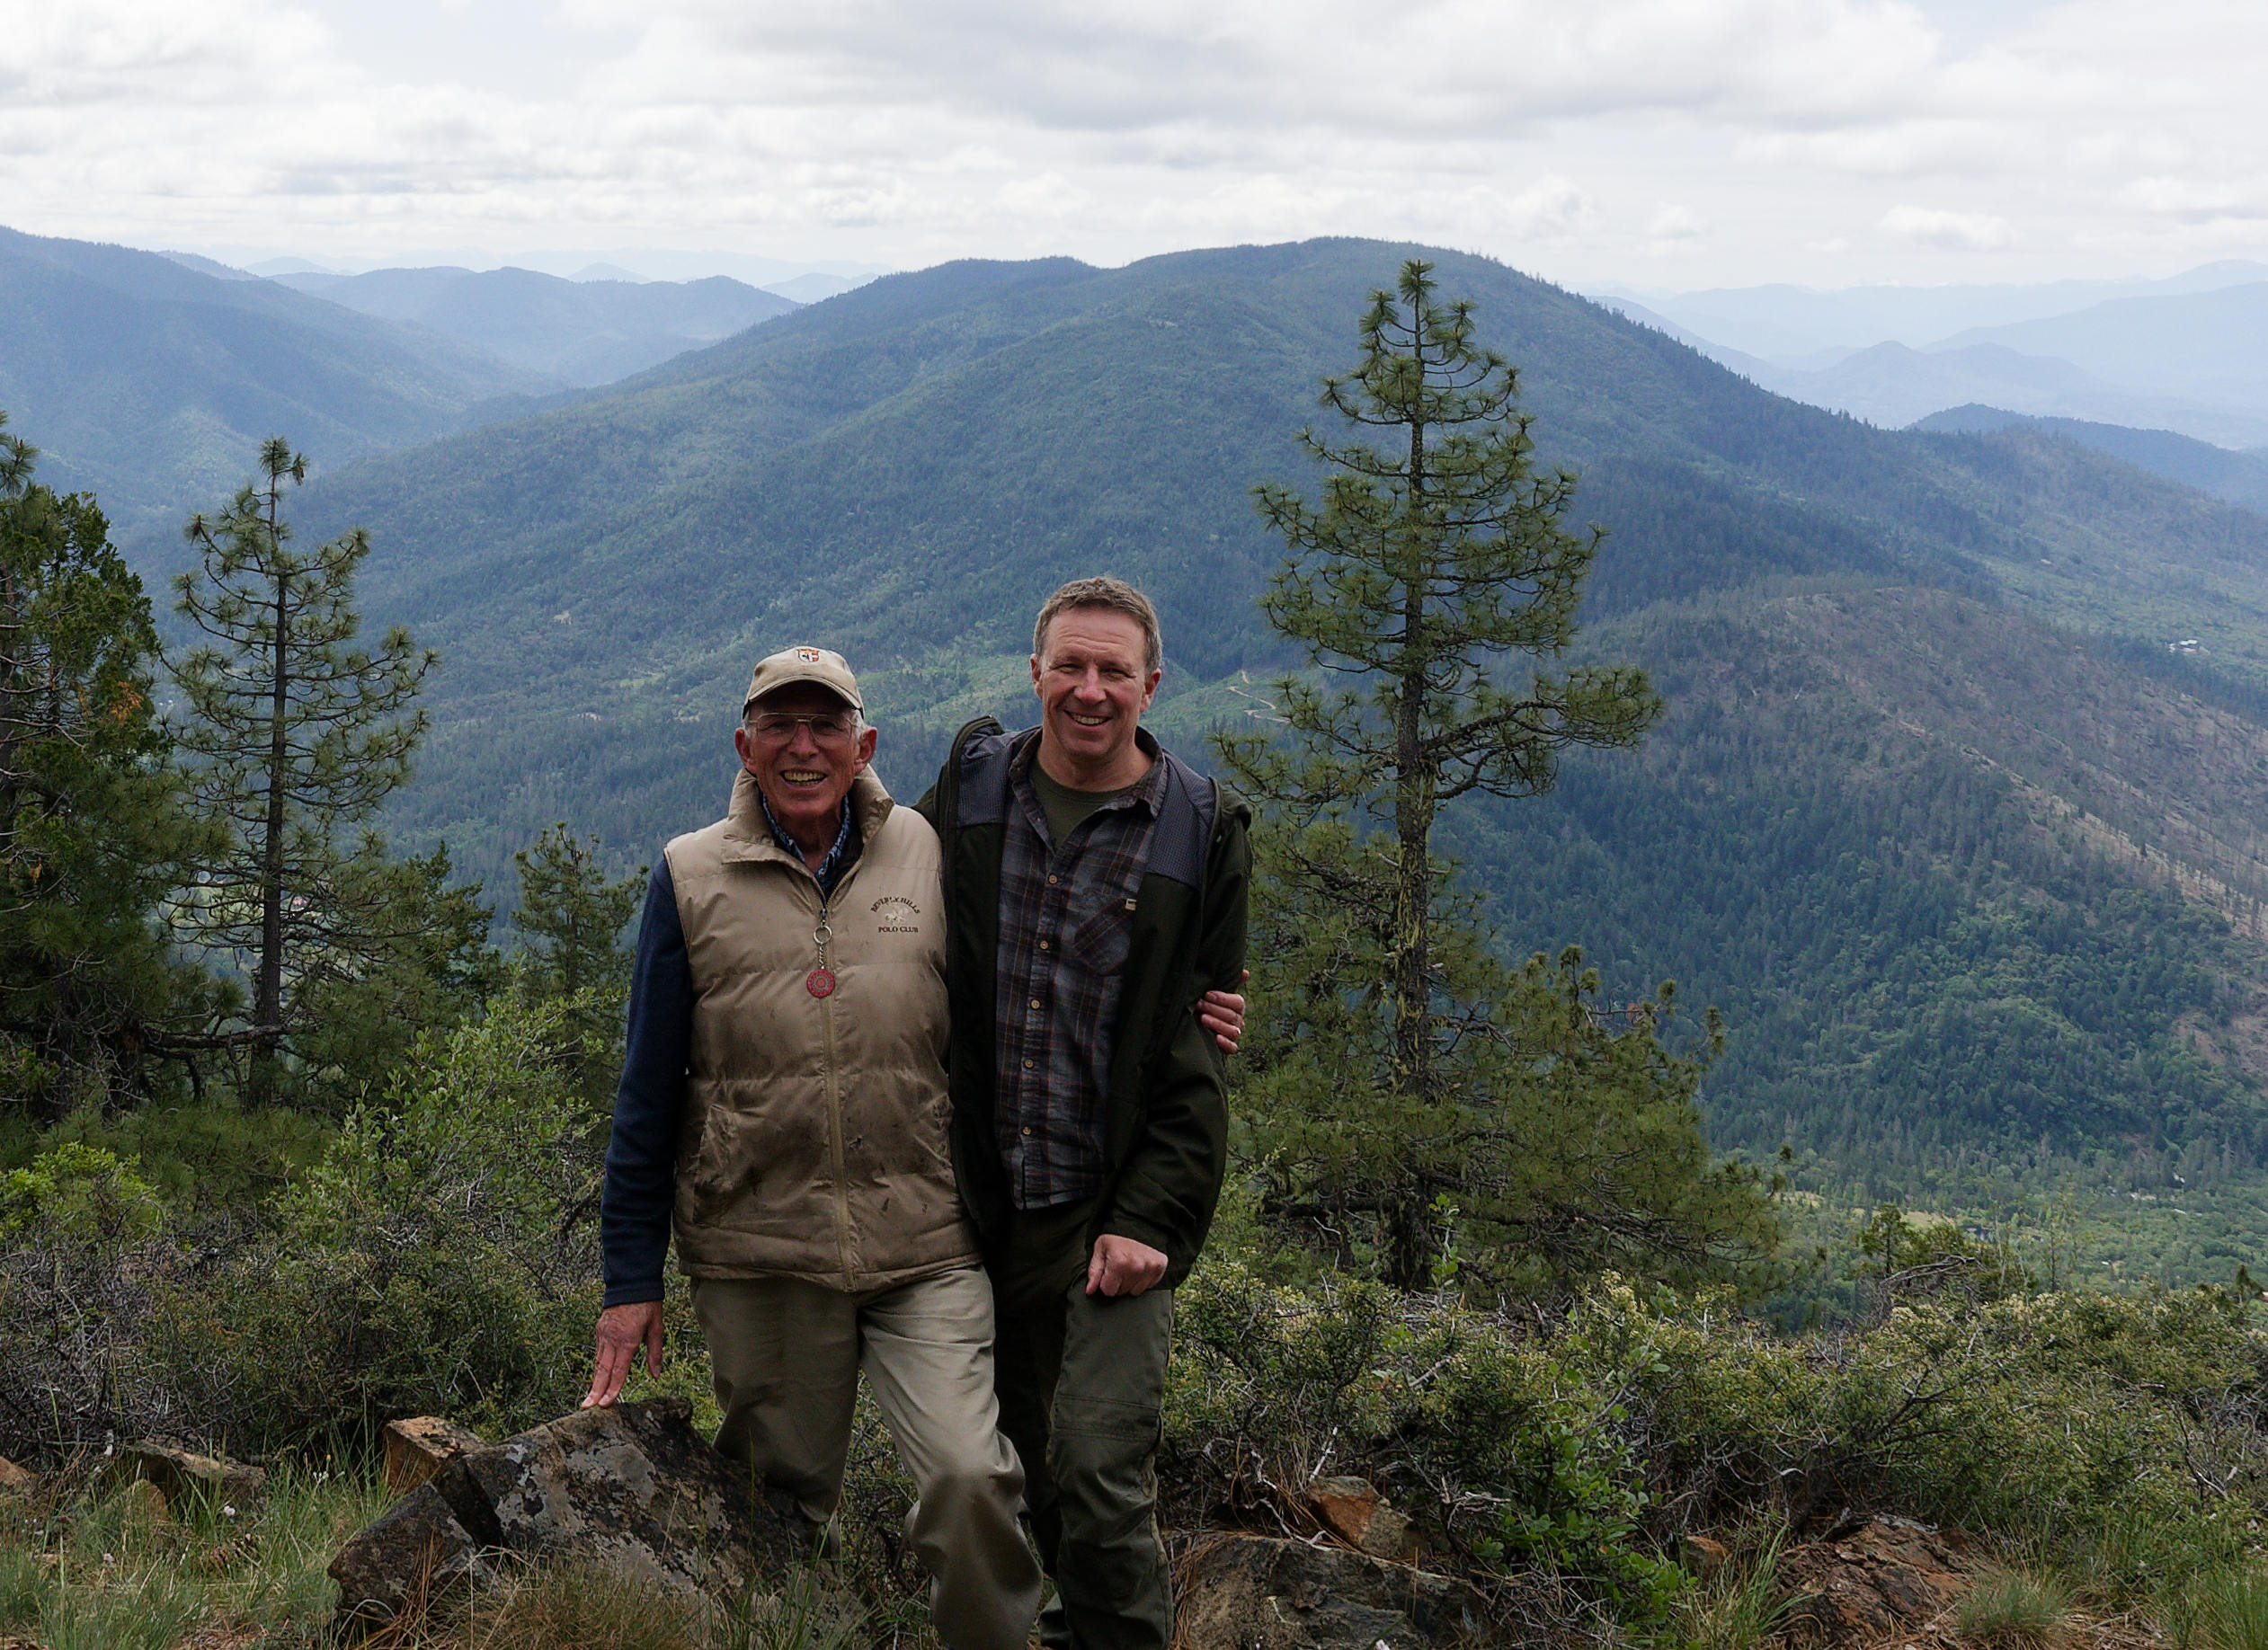
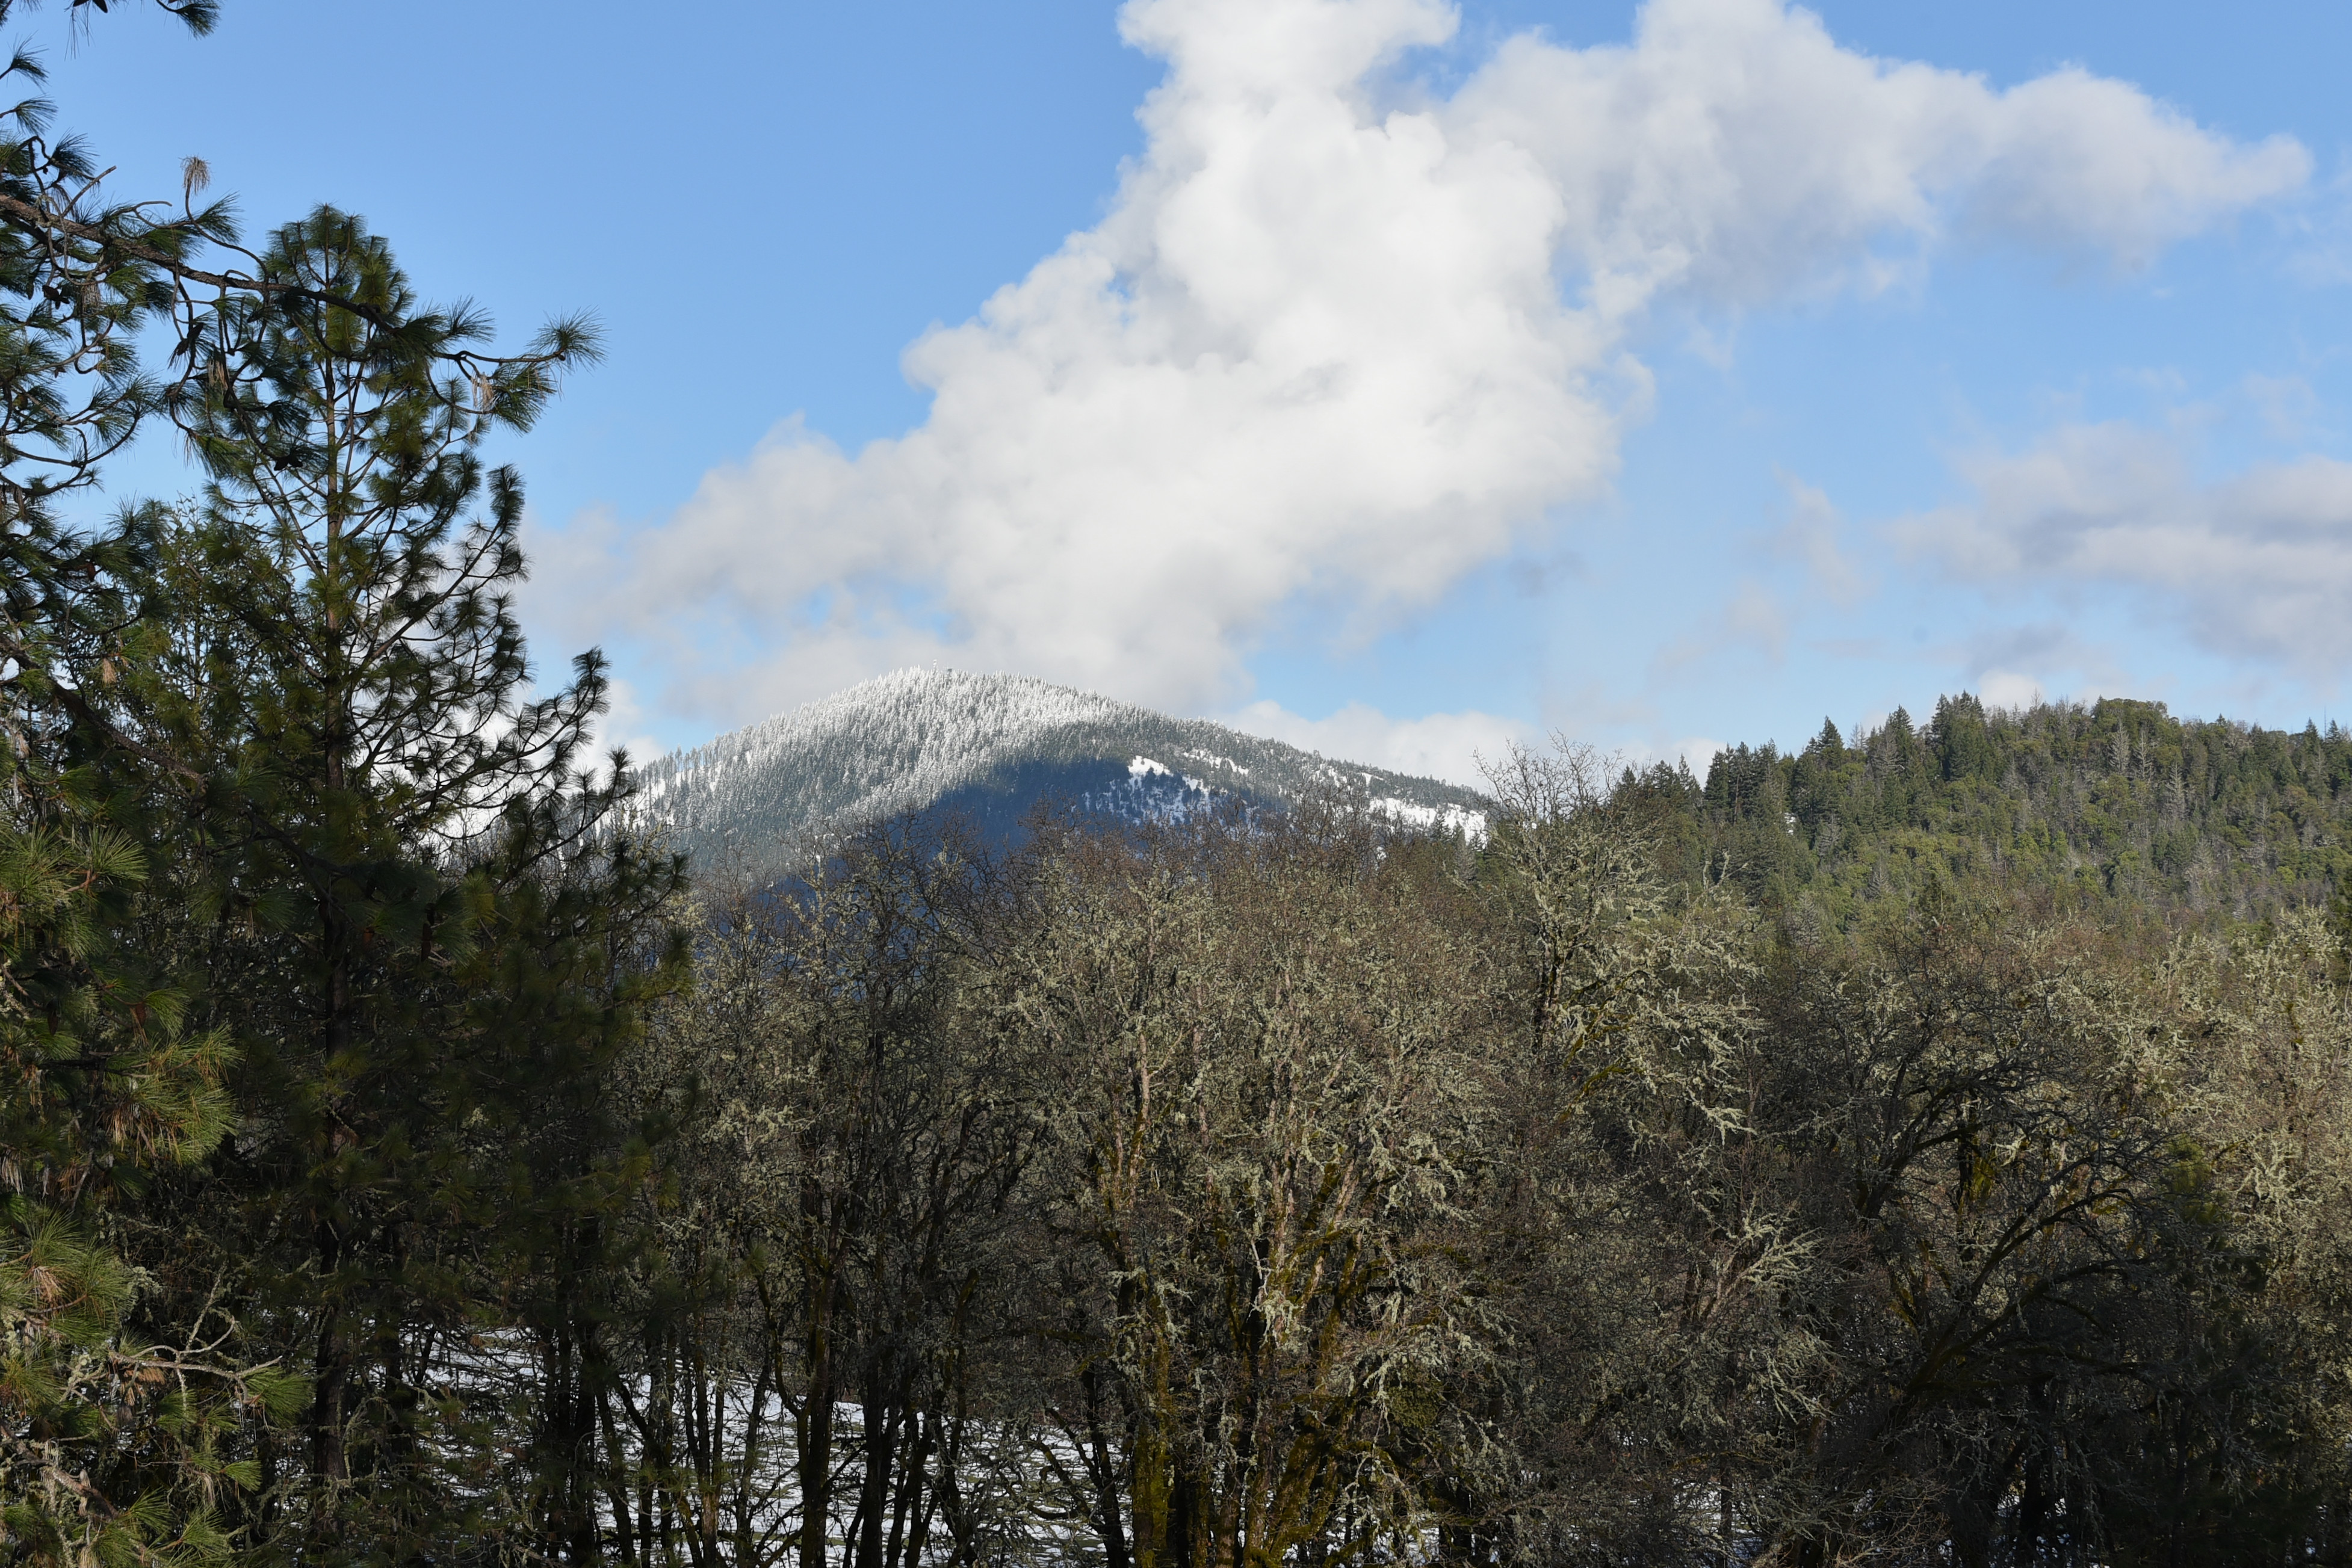
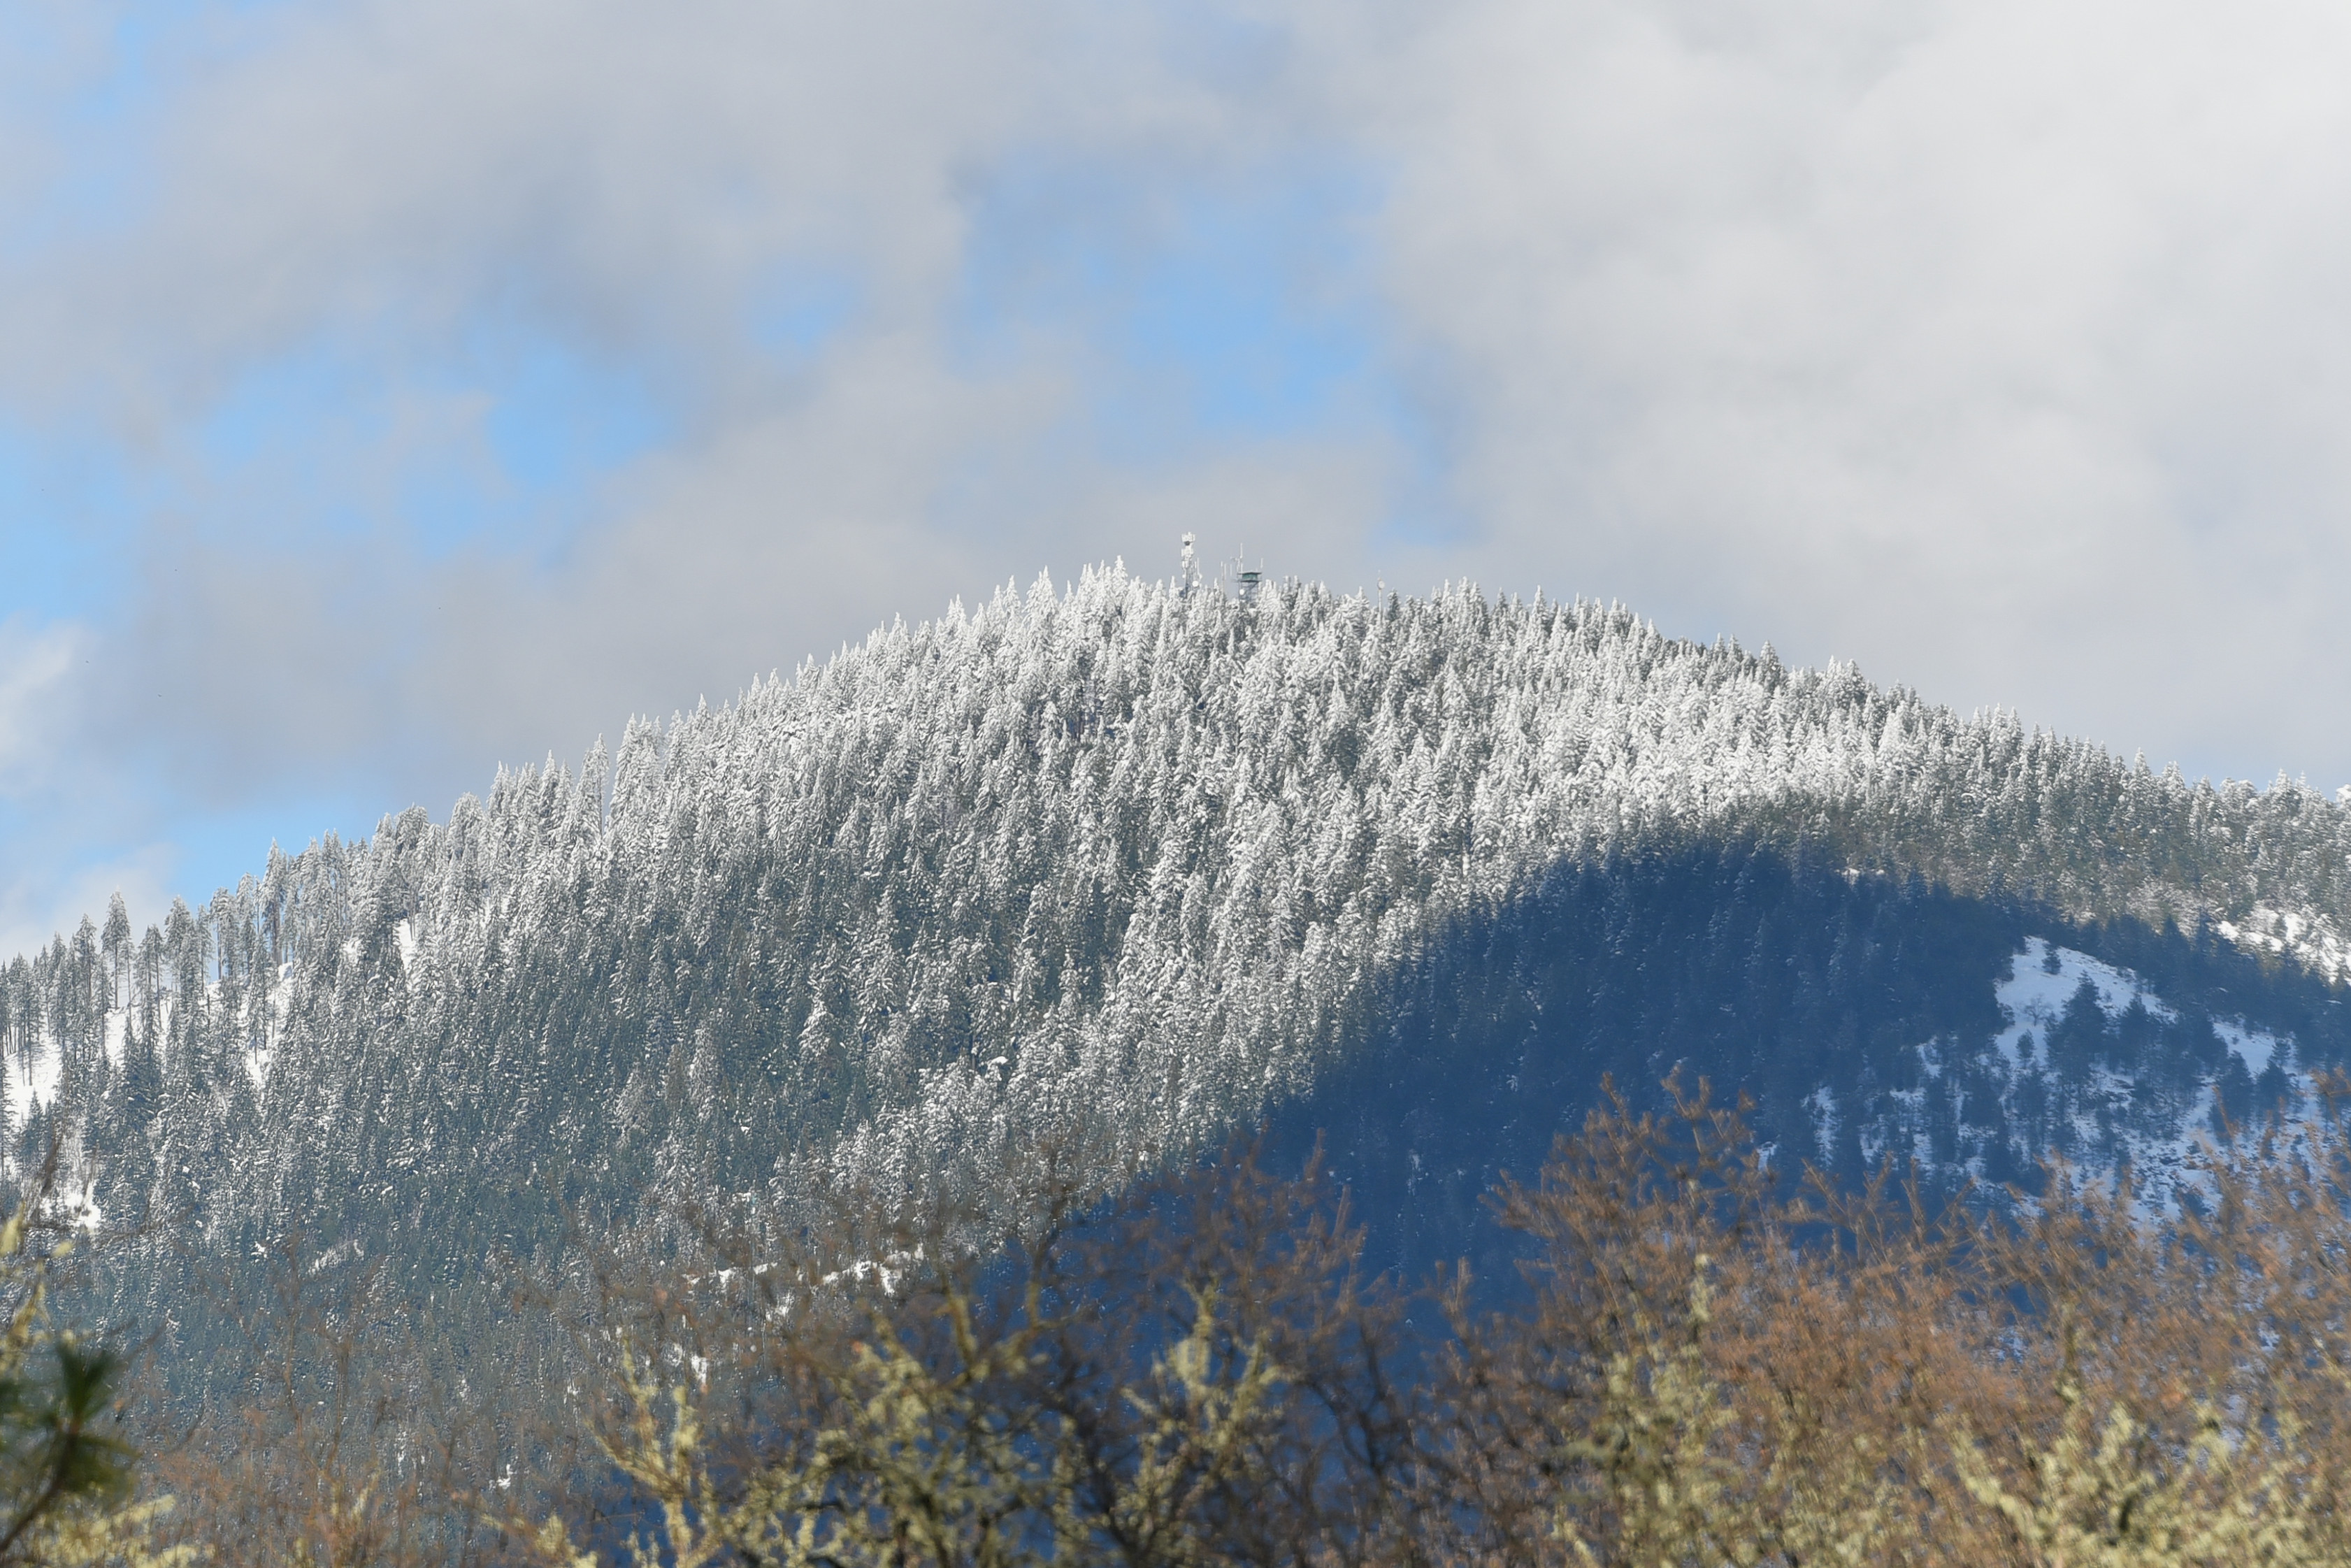
When my son and his partner, Lisa, were with us, just over a week ago, Alex suggested that he and I explored Sexton Mountain; some three miles to the North-East, as the crow flies. Normally the final stretch has to be walked because of a locked gate across the trail. However, that day the last 8/10ths of a mile were driven. It was a beautiful place with that summit 3,833 feet above sea-level (U.S. Geological Survey).
The Summit.
oooo
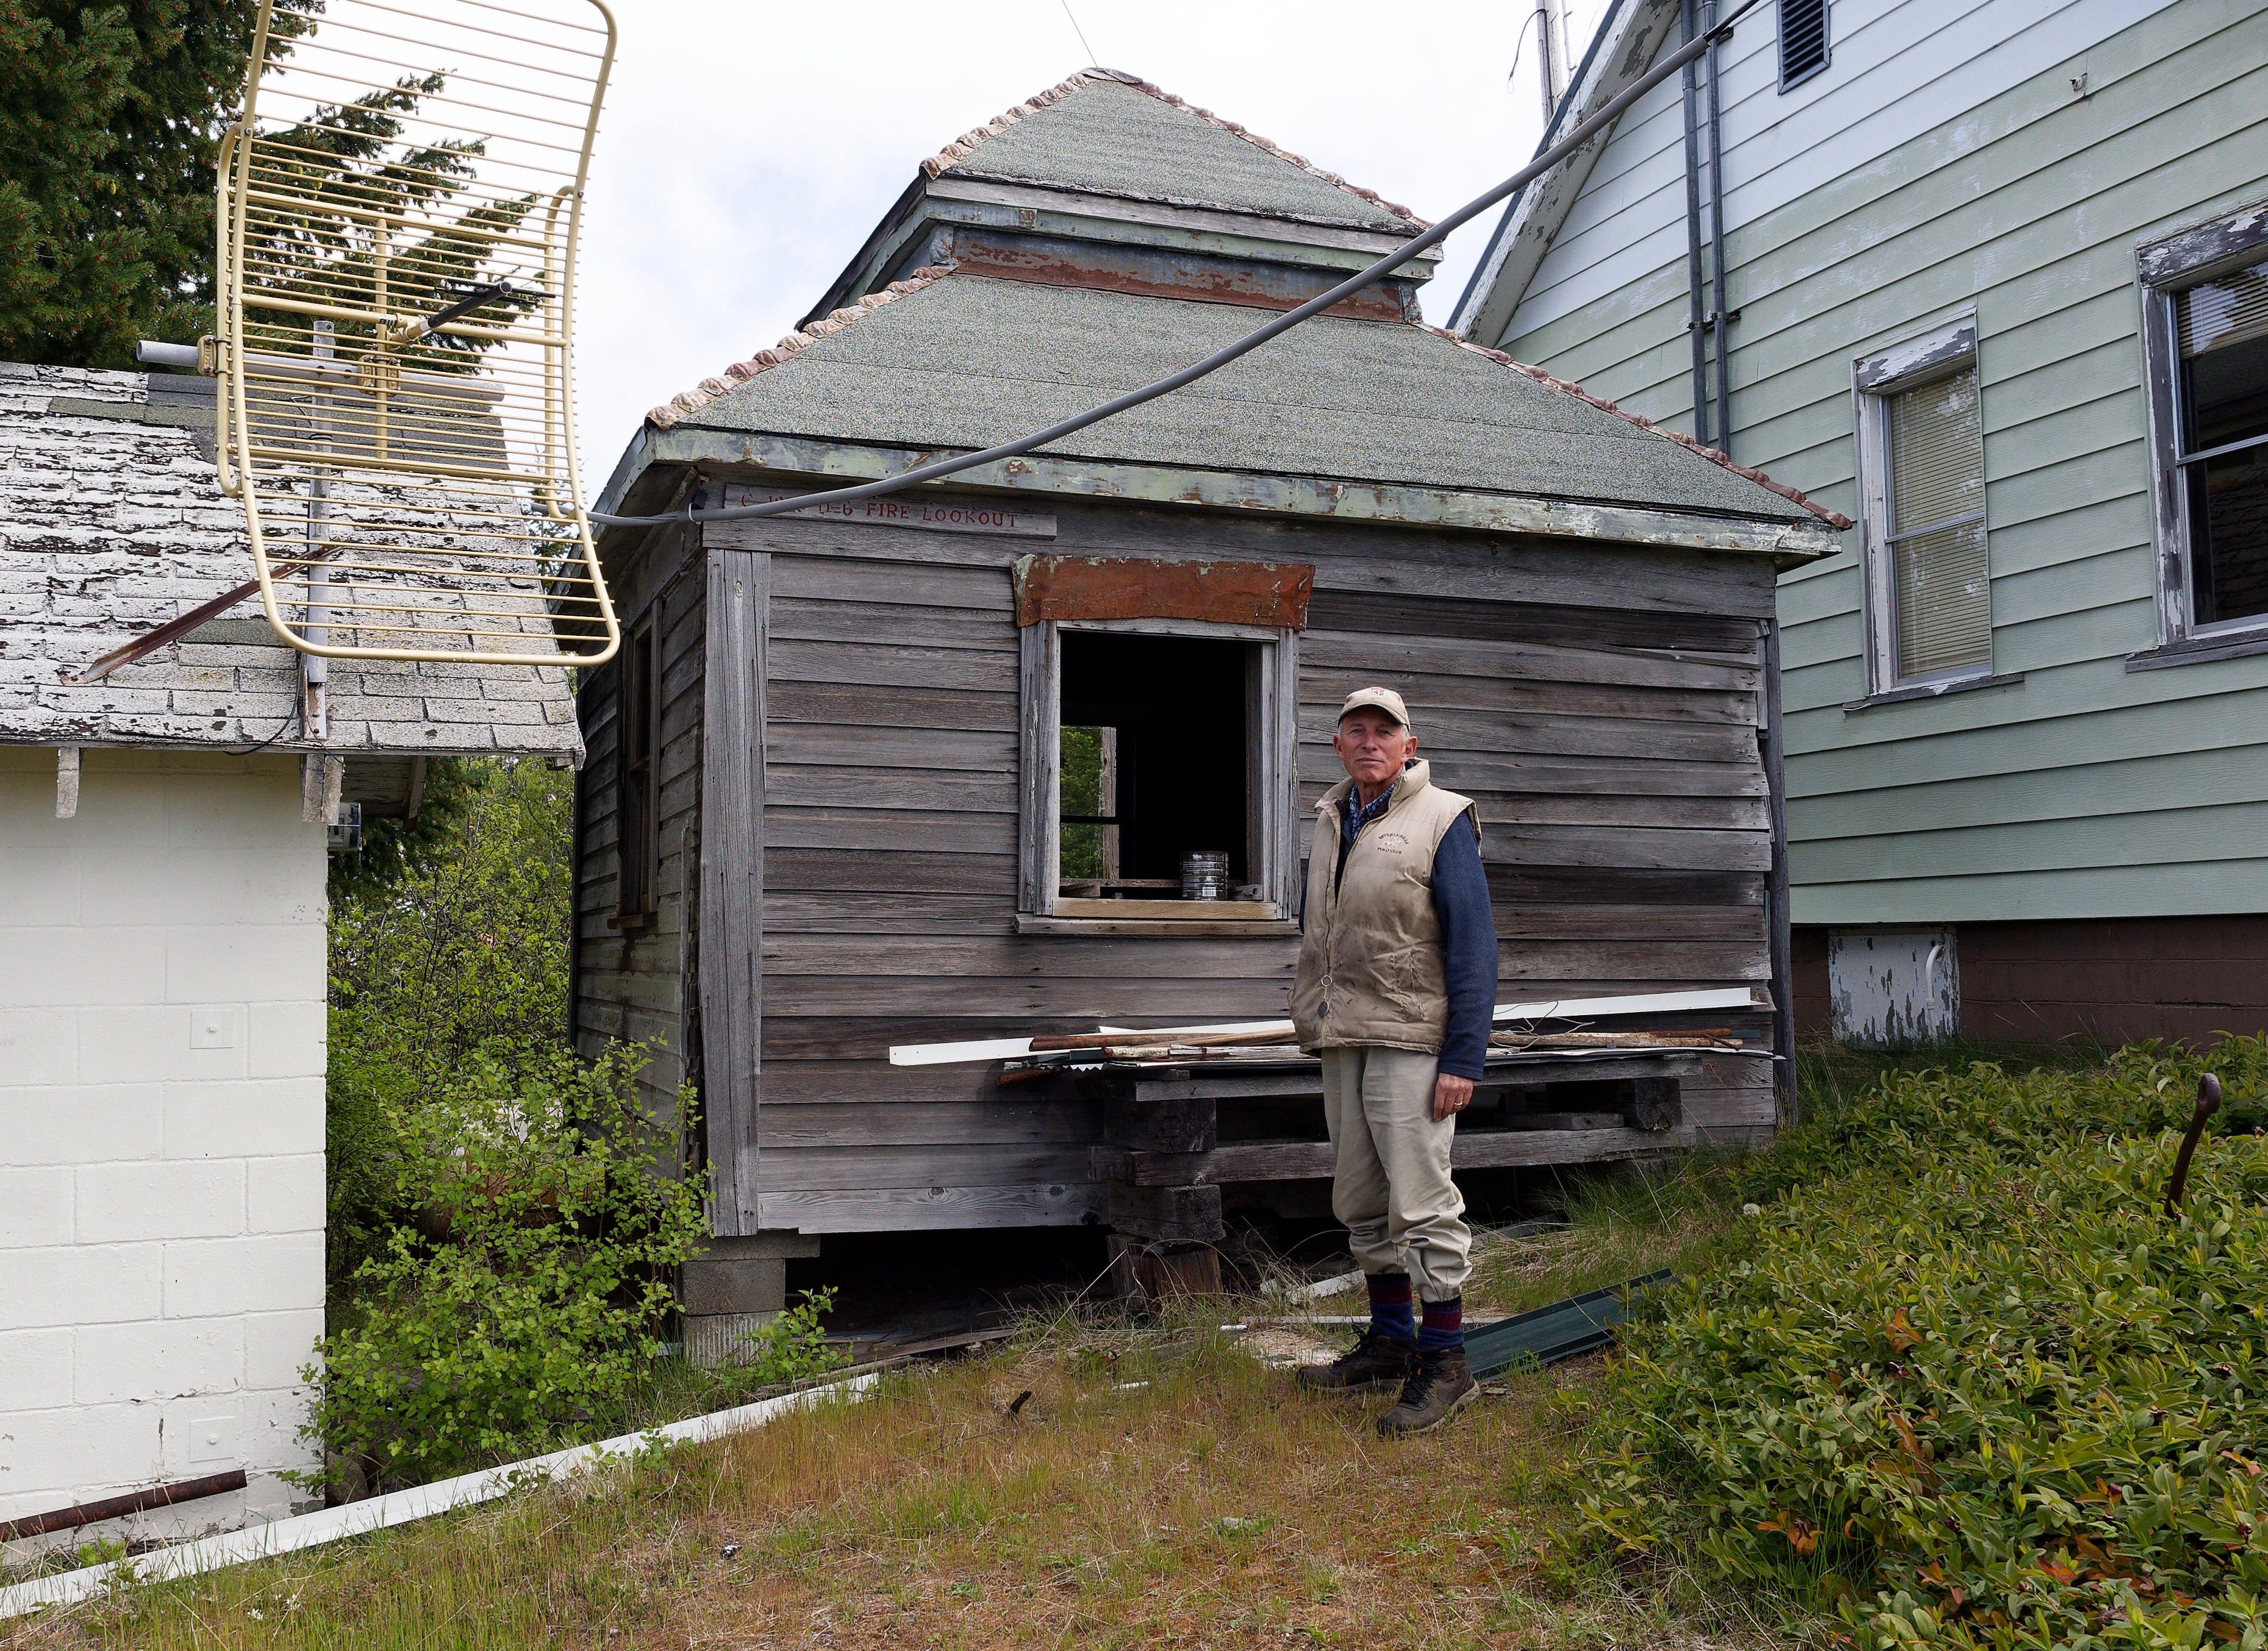
The original fire lookout.
oooo
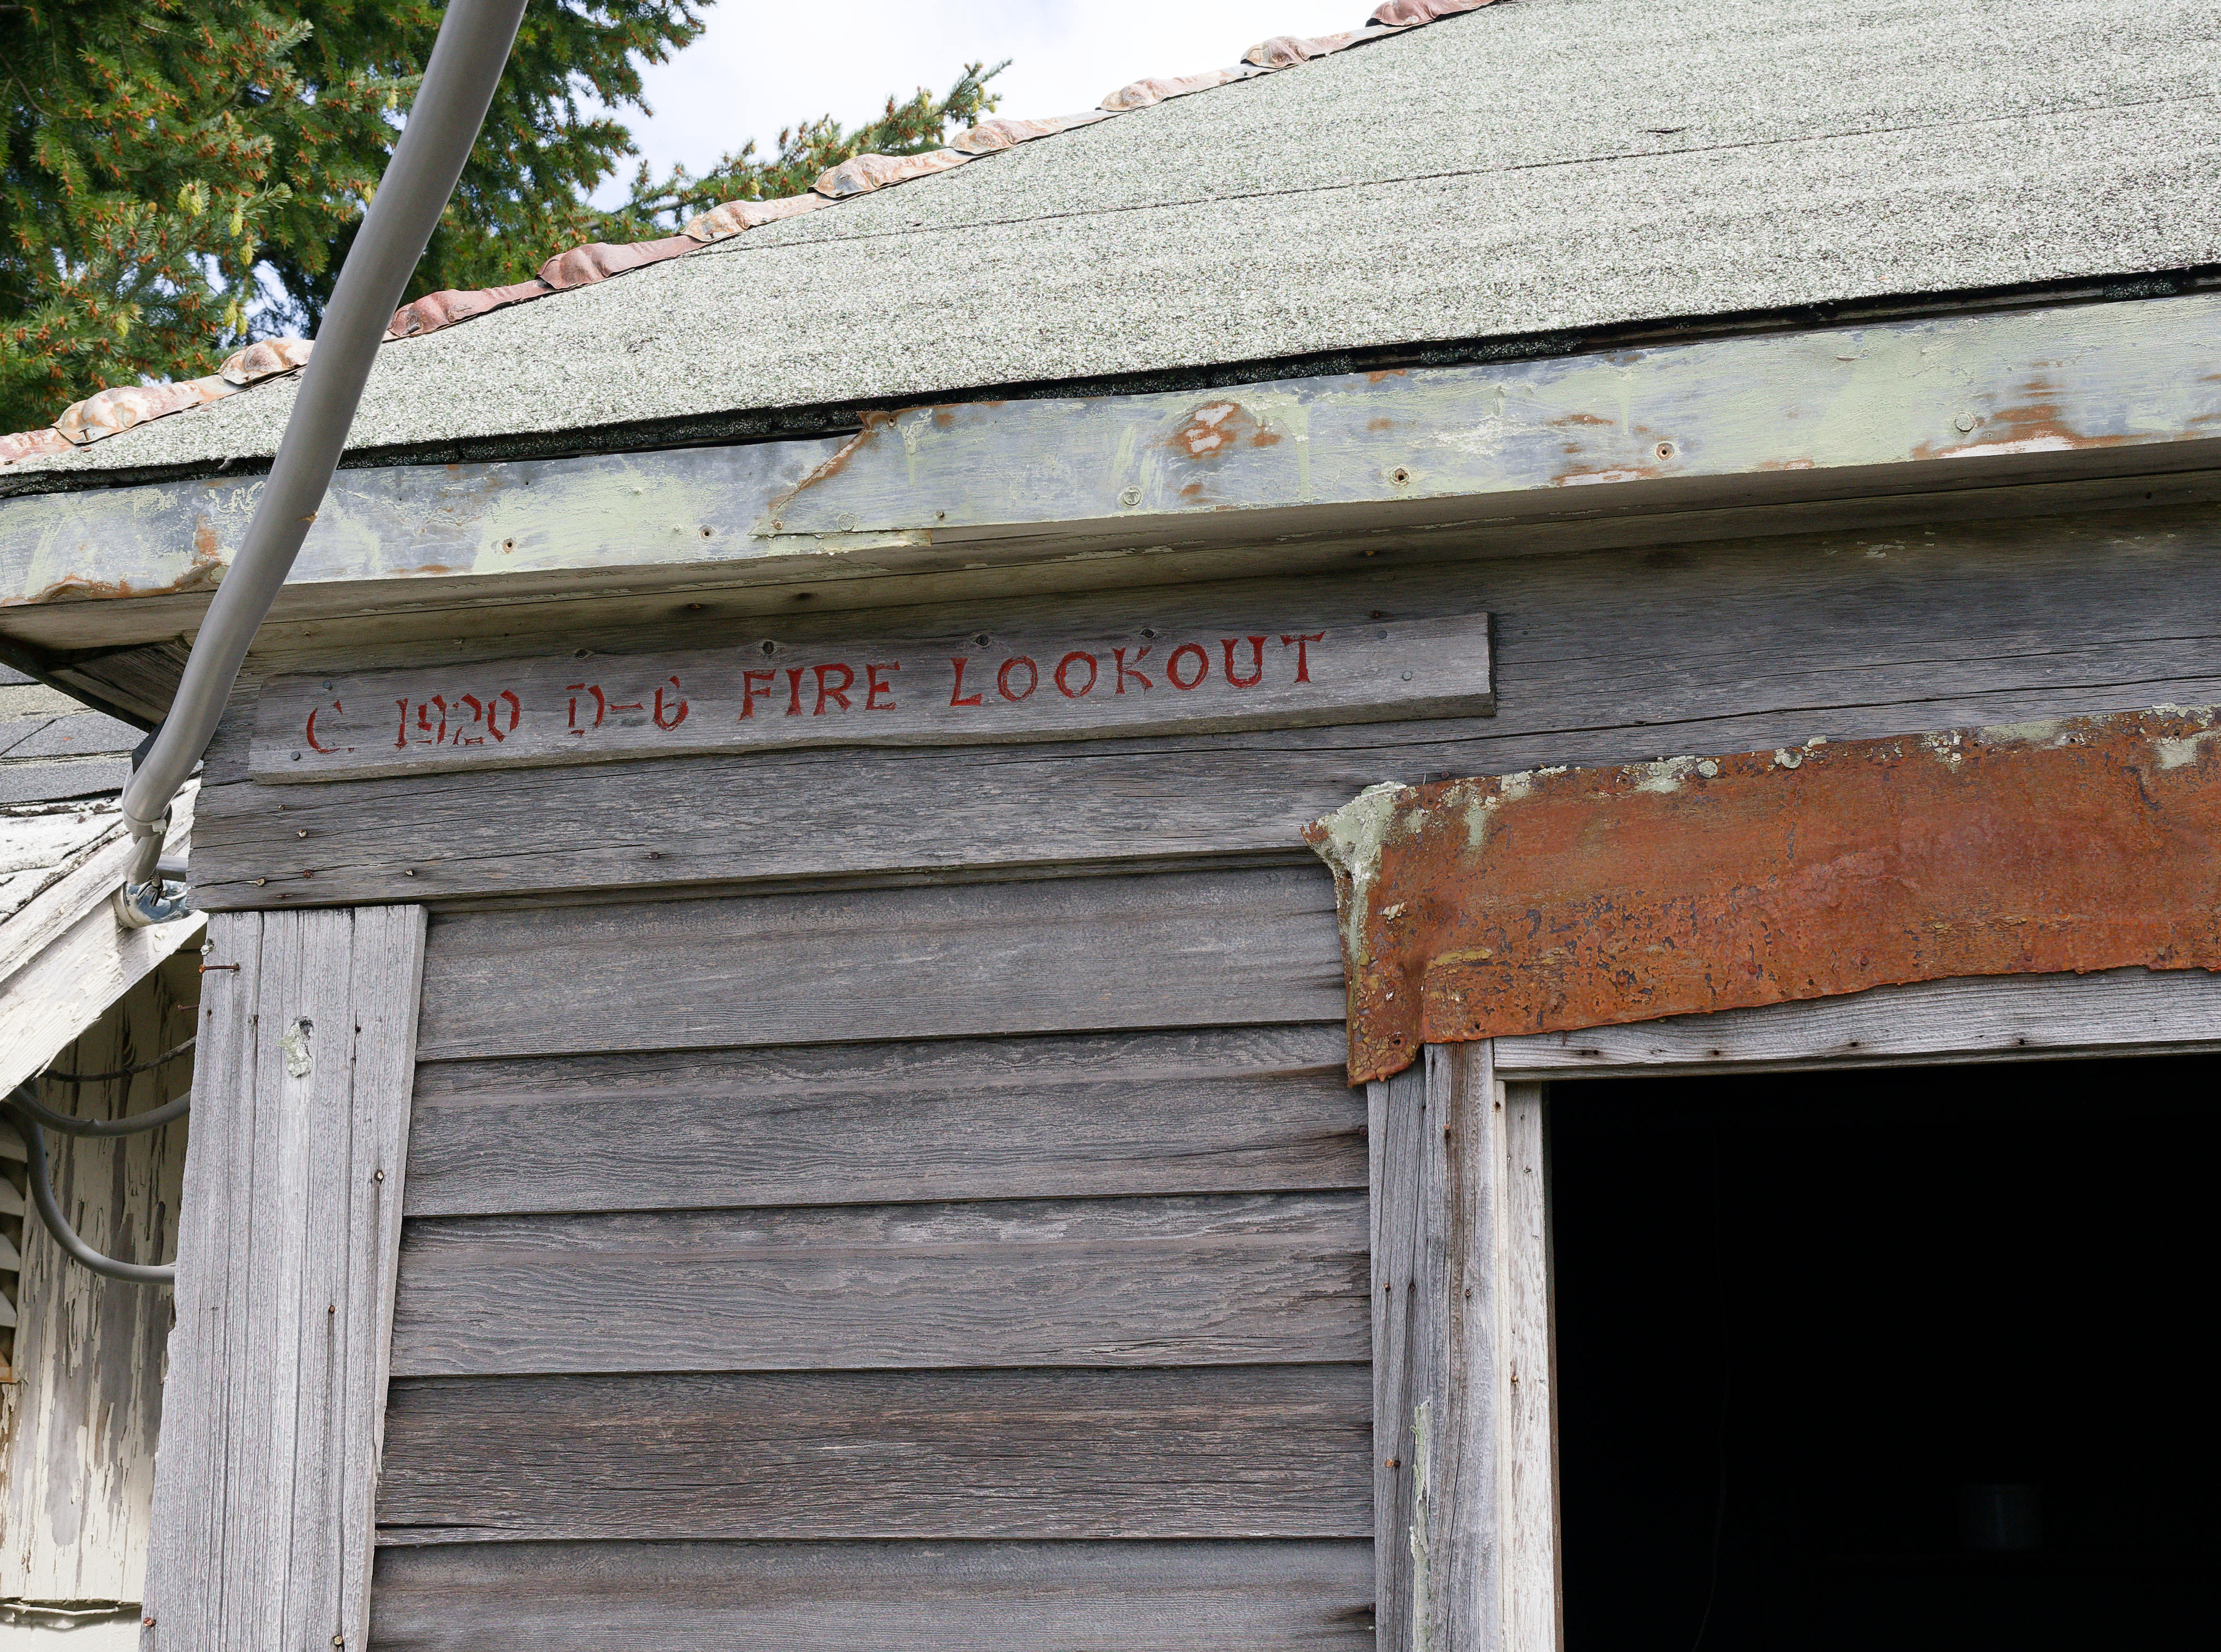
Confirmation of the year – 1920.
oooo
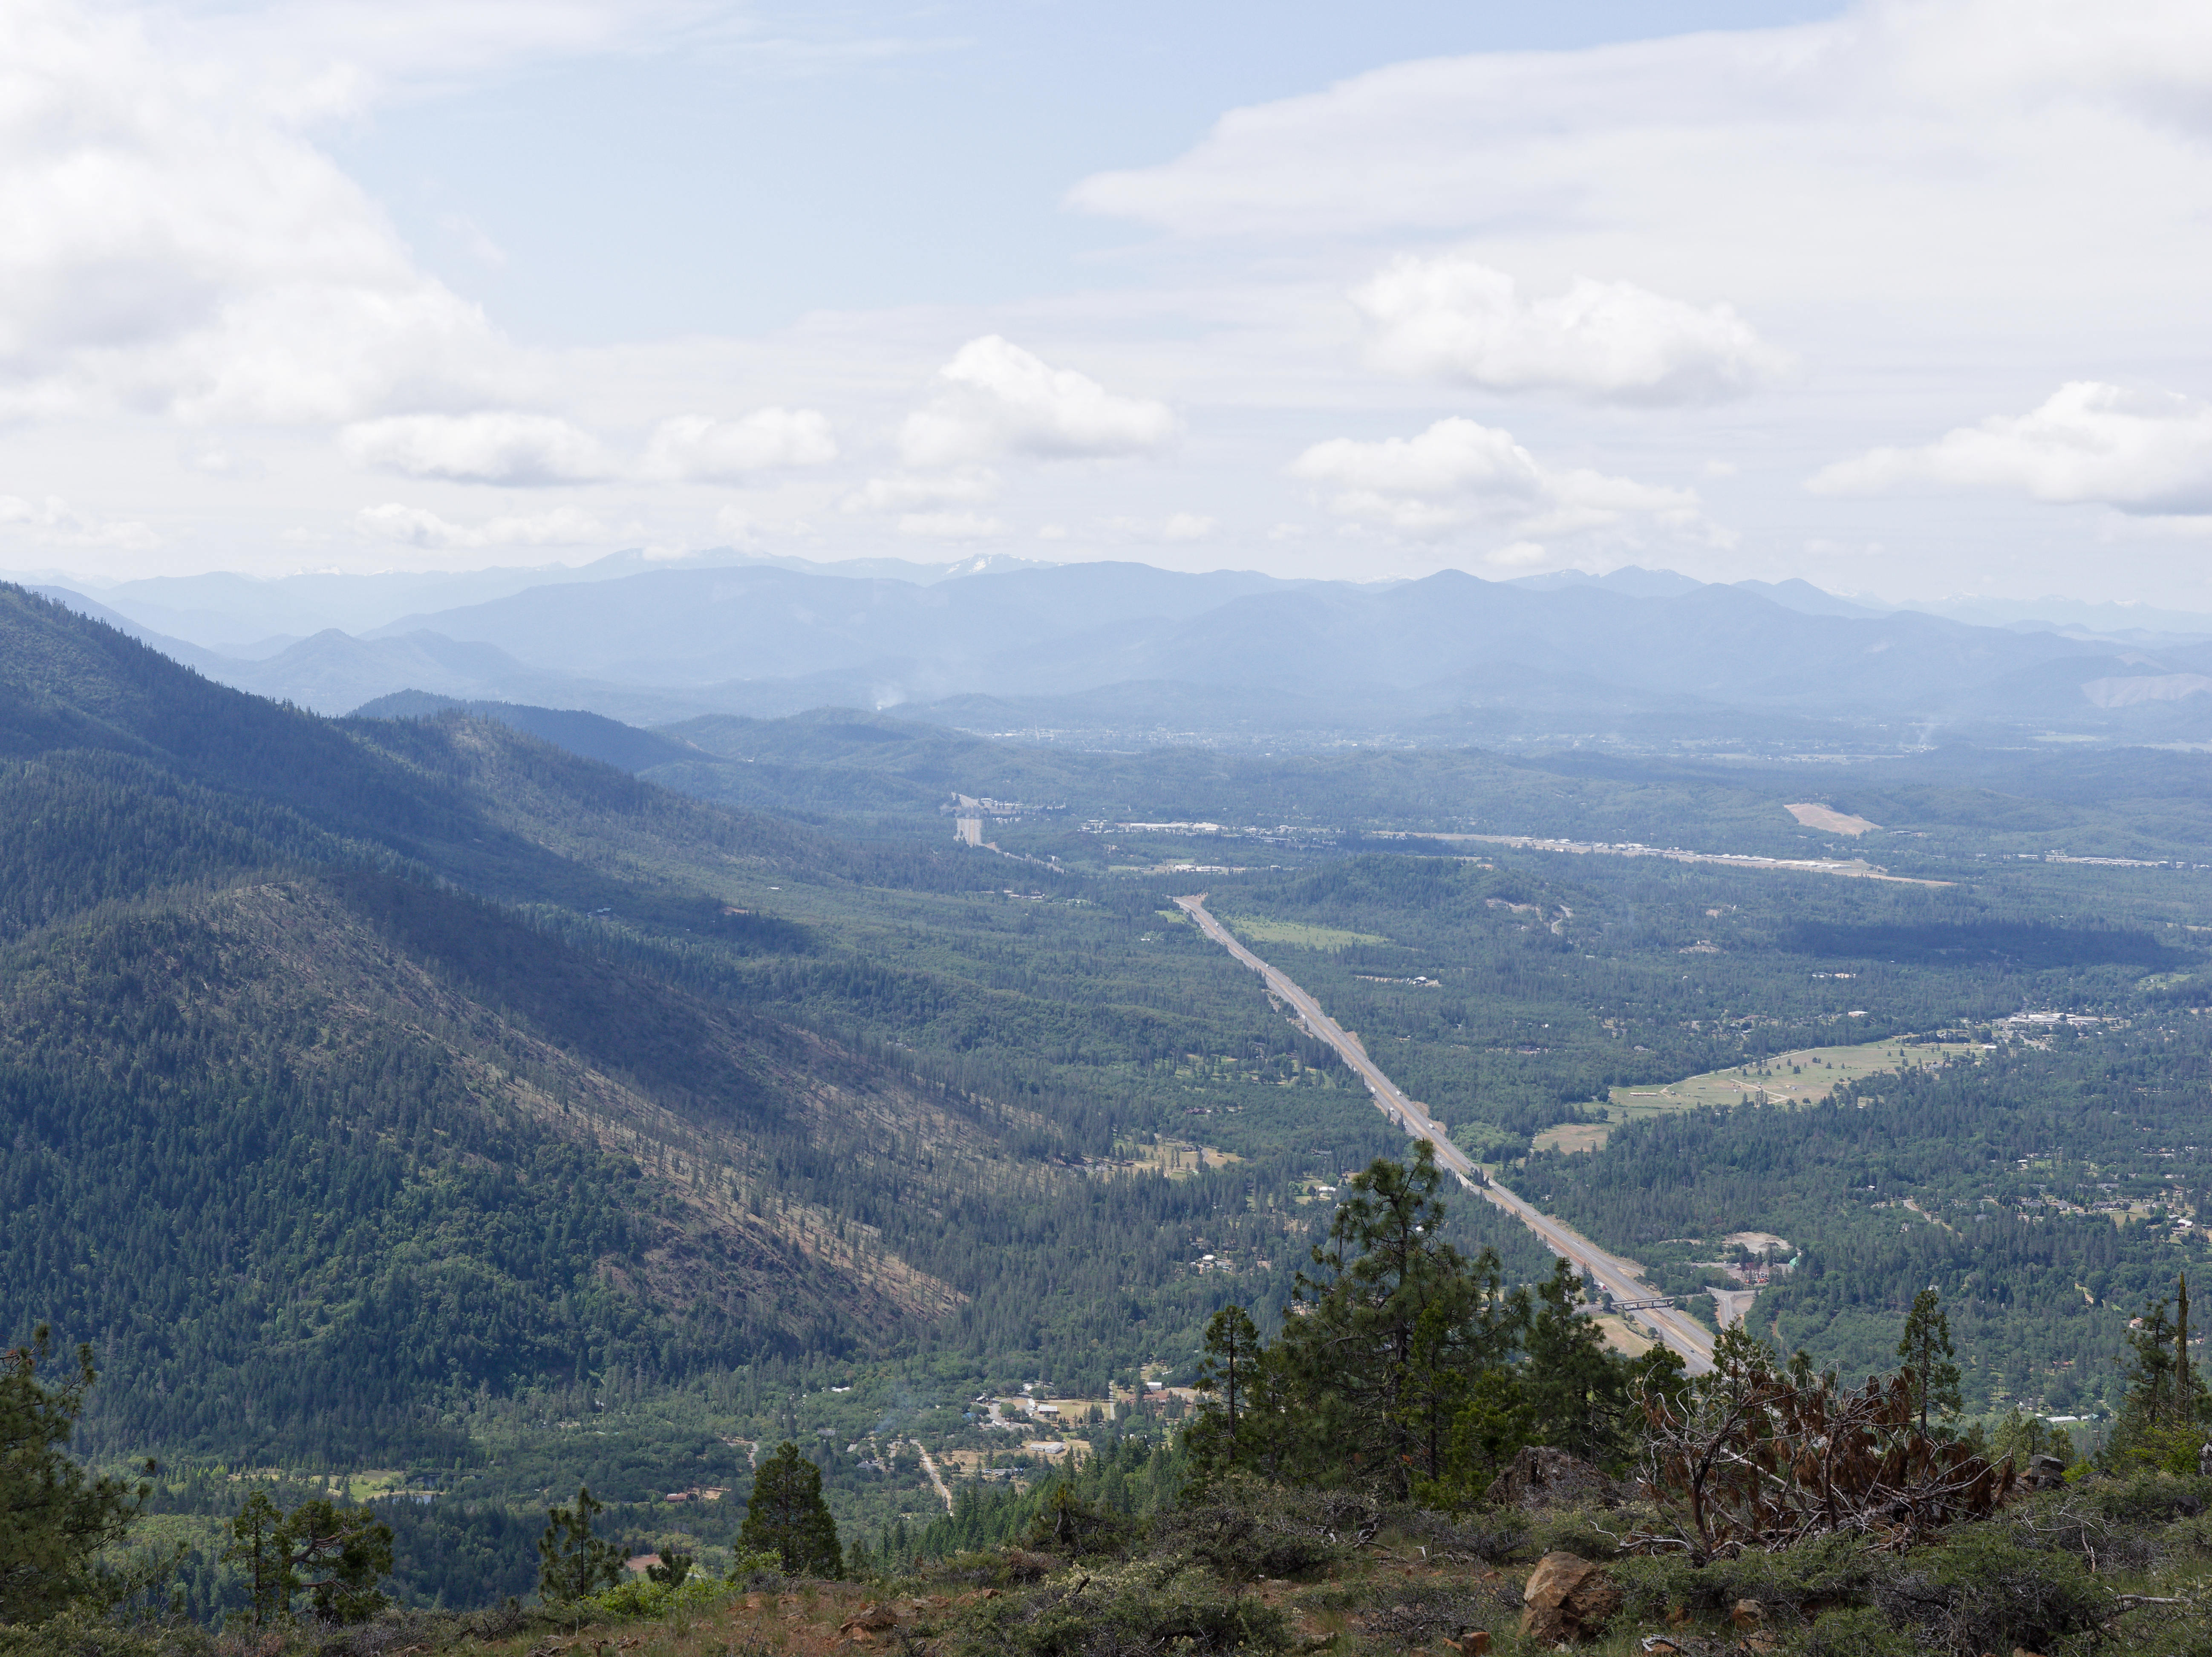
We descended 200 feet to be clear of the overhead cables. This is the view looking towards the South; the road being the I-5.
My last post was about an accident that I had on the 17th November, last.
Jean is now back home; she came home on Friday, 13th December. However, every day we have a caregiver at home for part of the time. Jean is getting slowly better. I would estimate that at about one percent a day.
I am unsure as to the pattern of my posts. Whether I should go back to scheduling posts three times a week or publish posts on an ad-hoc basis. That will become clearer over the next few weeks.
I am going to start with publishing posts on an ad-hoc basis.
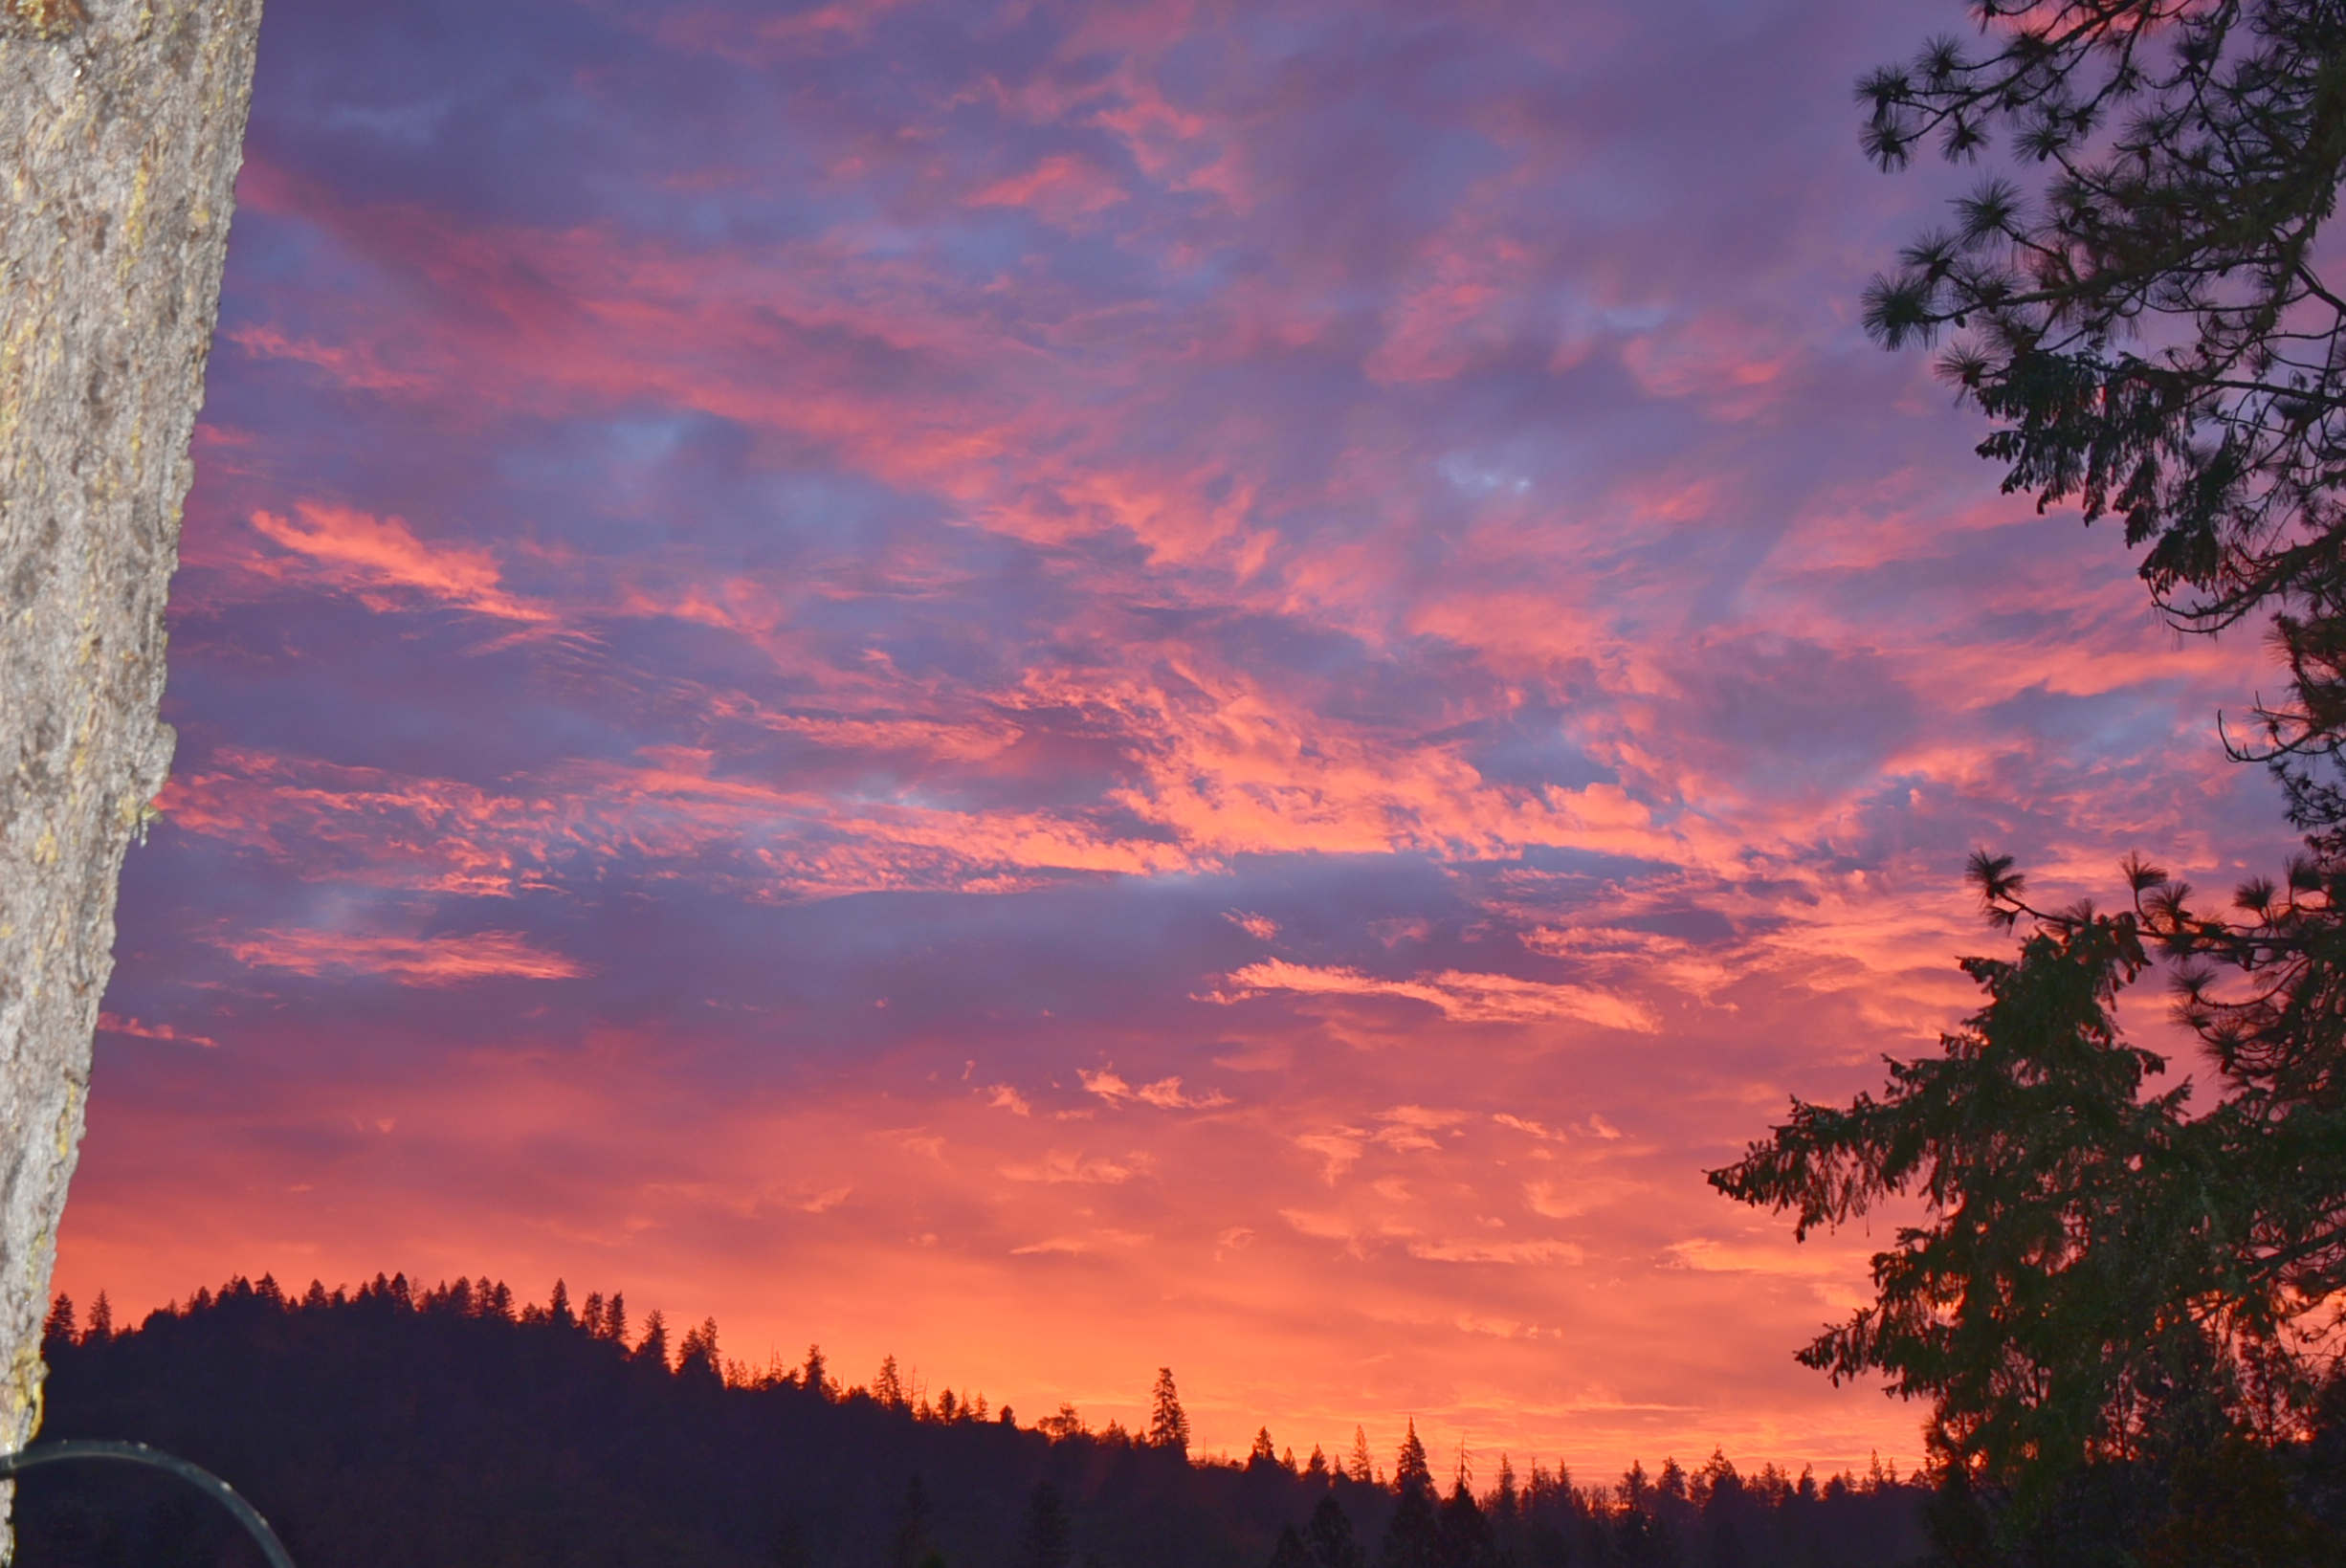
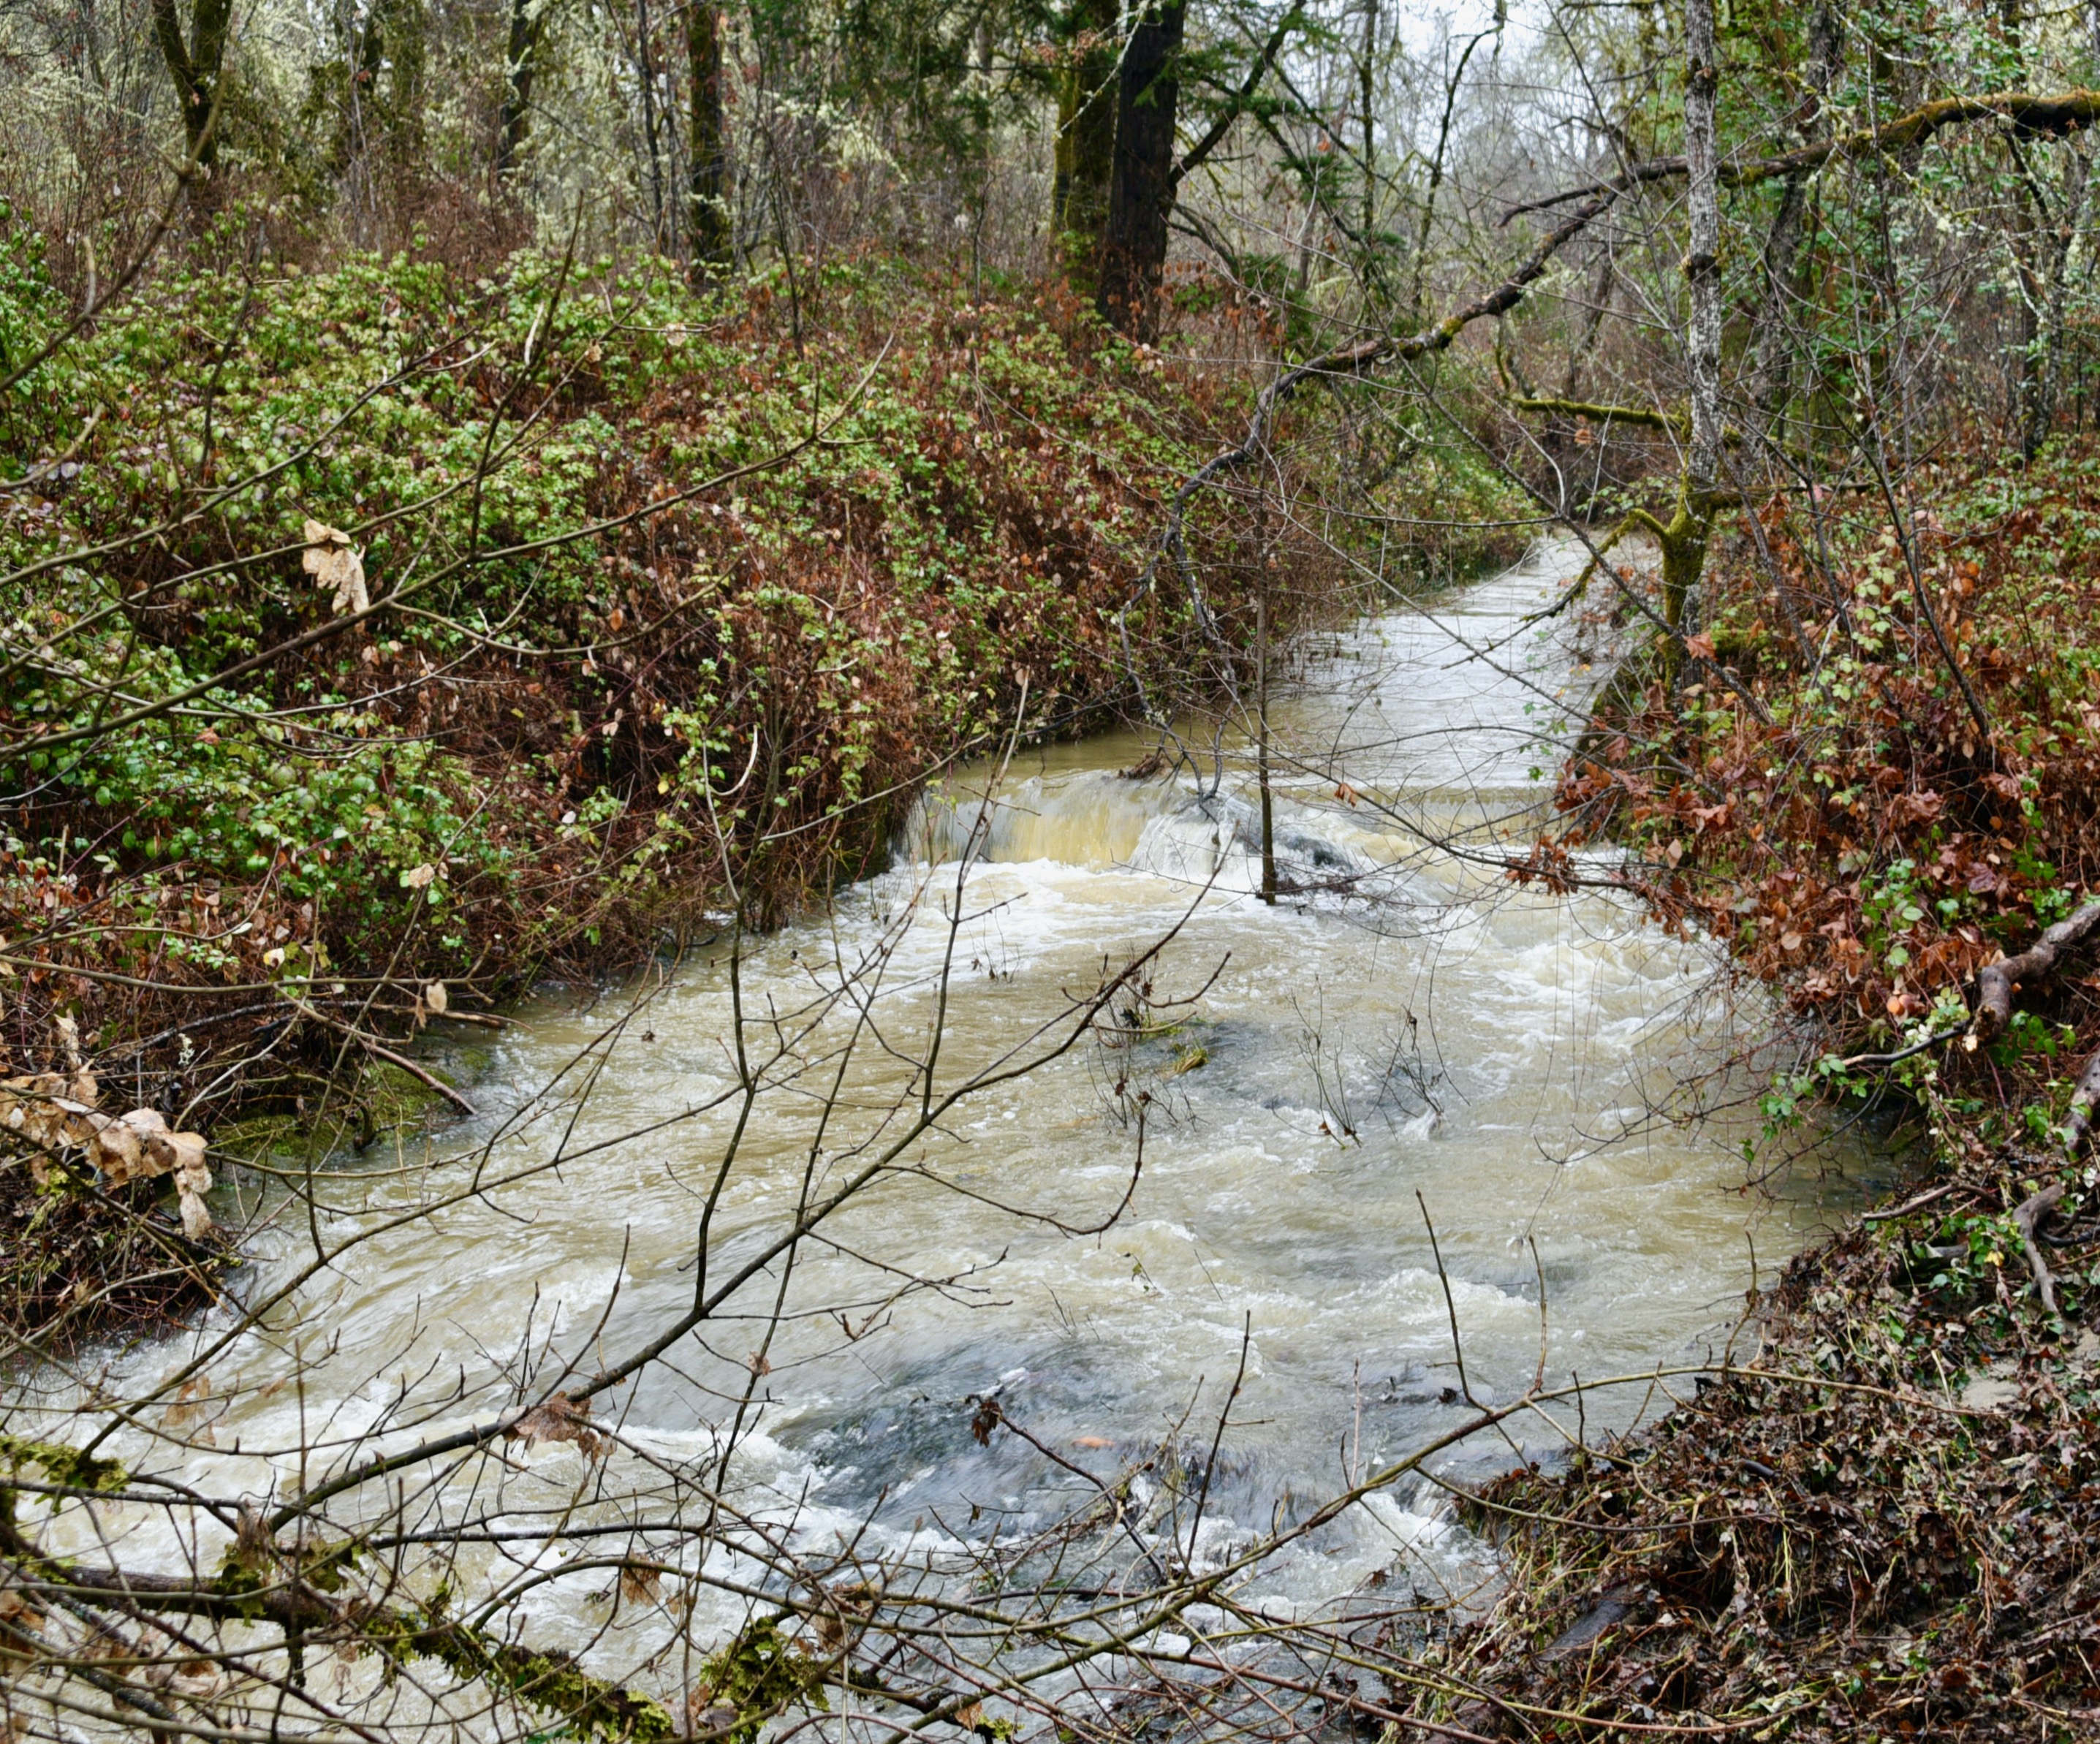
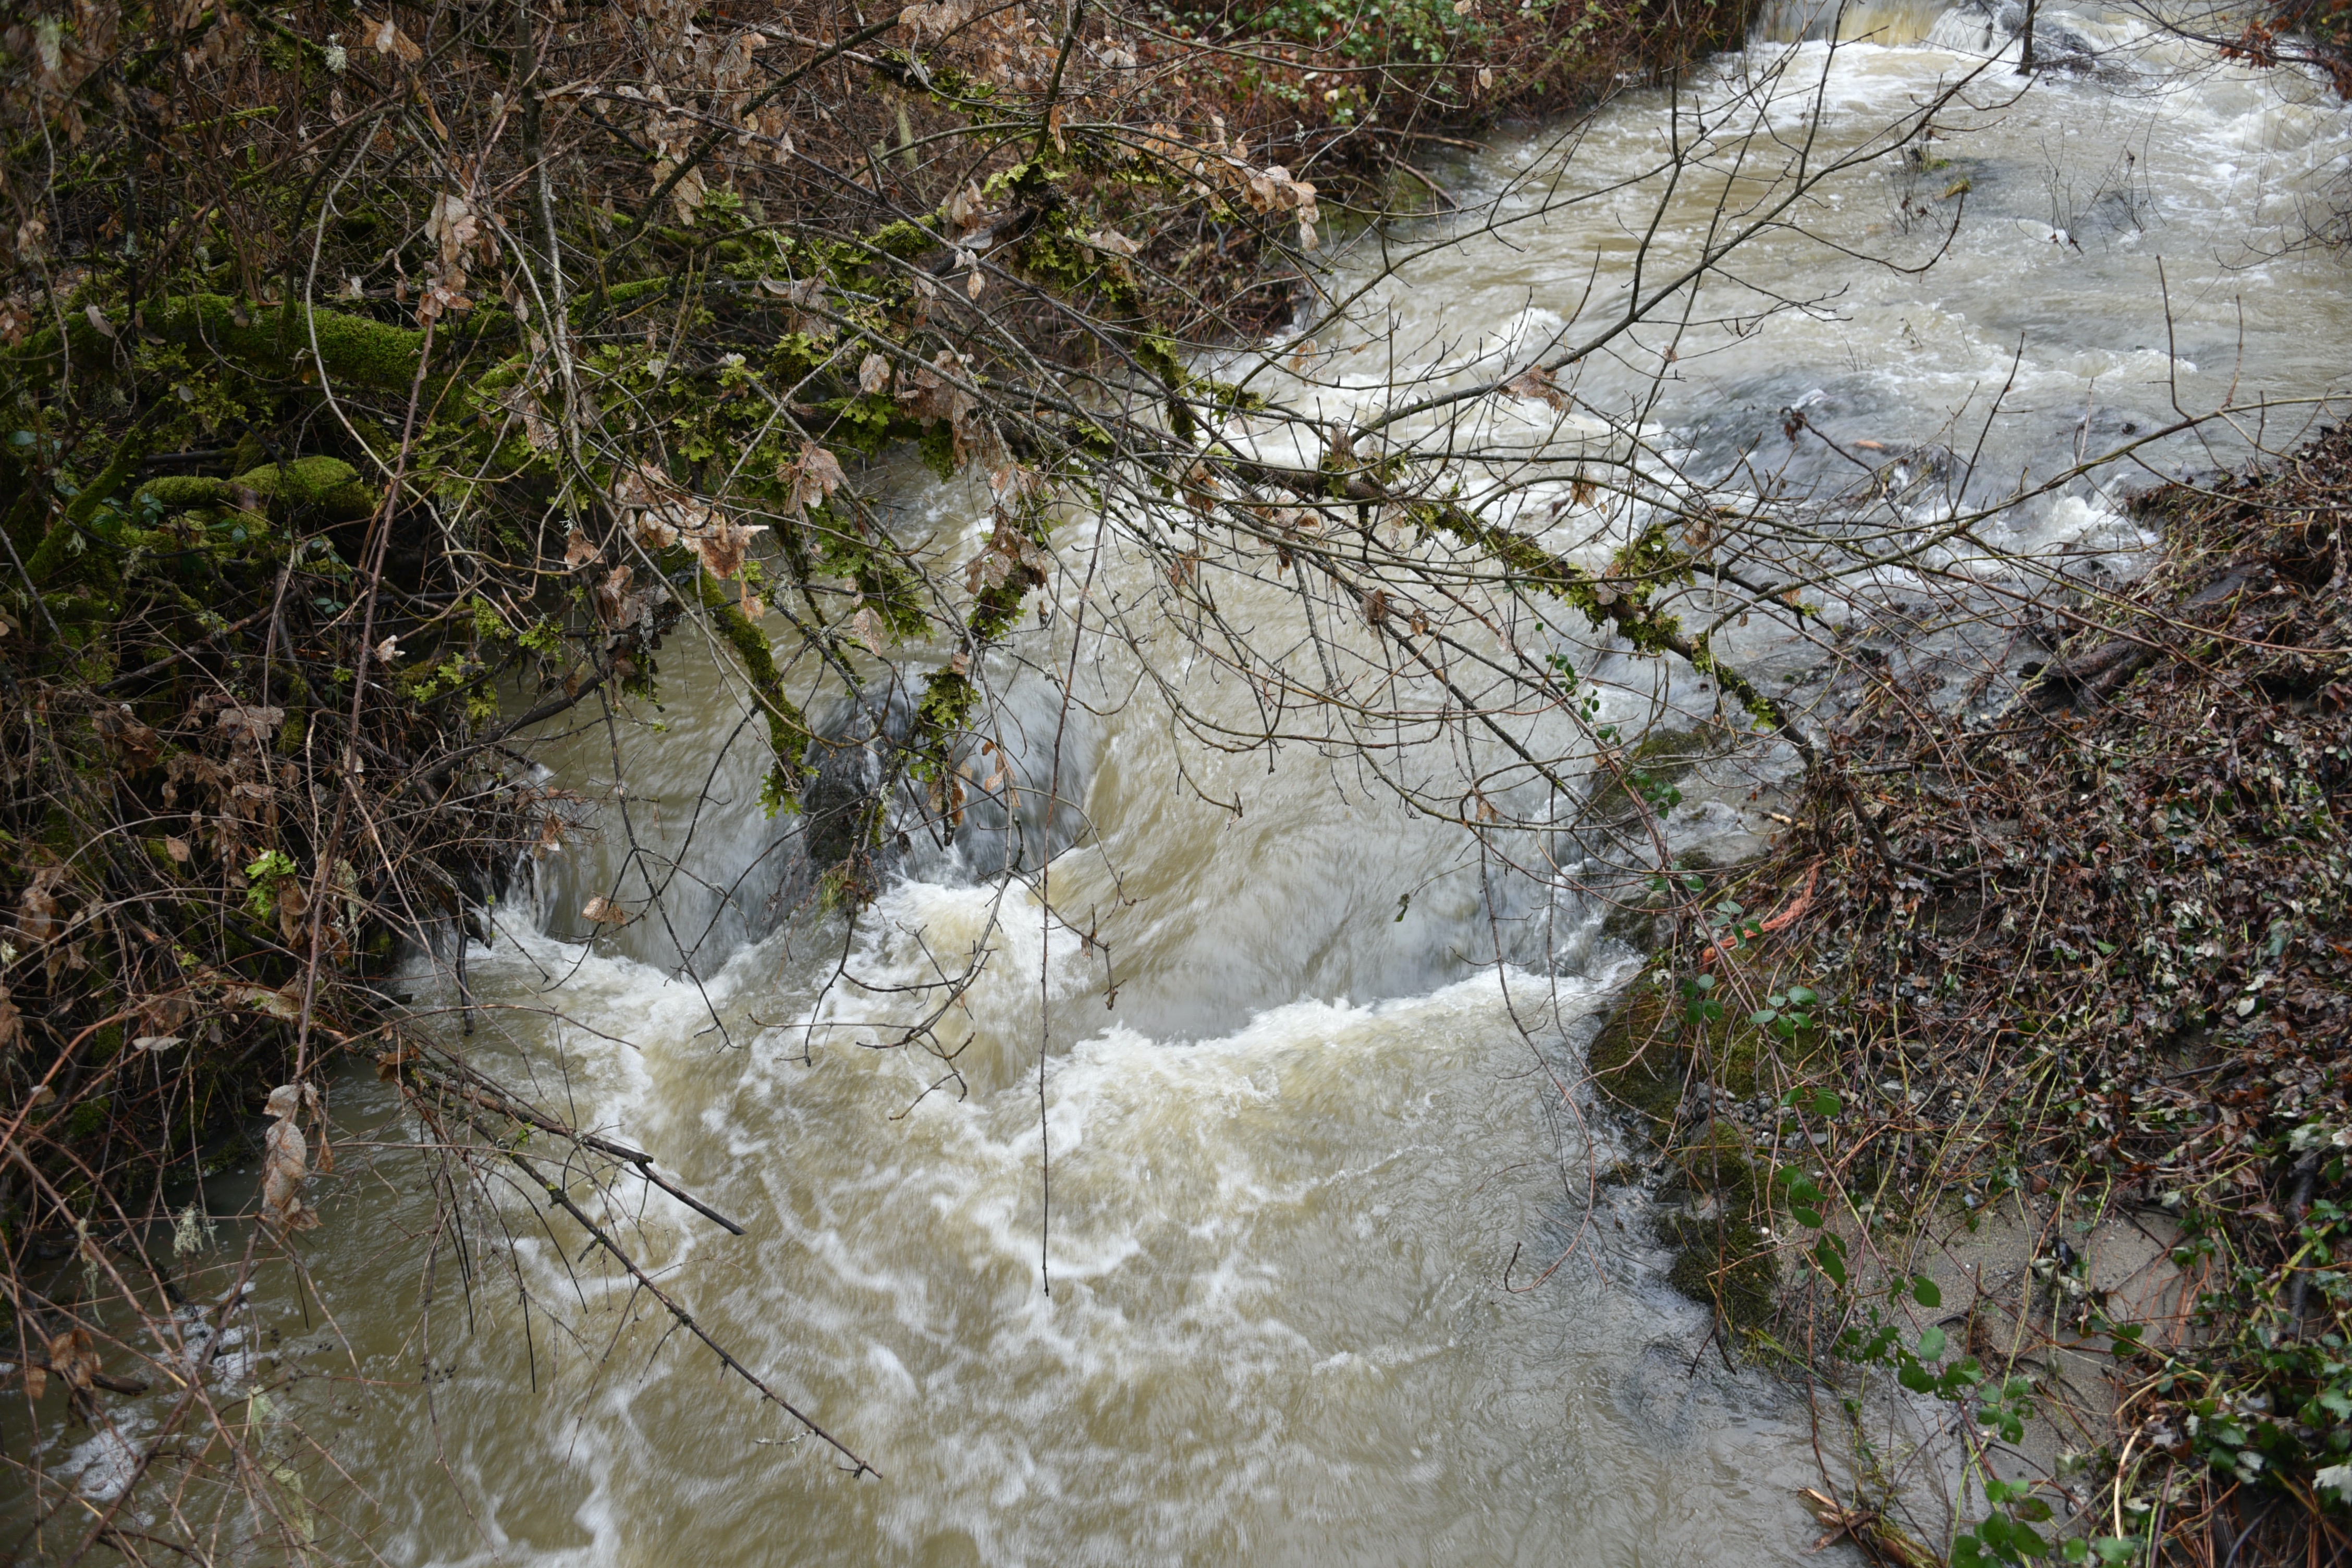
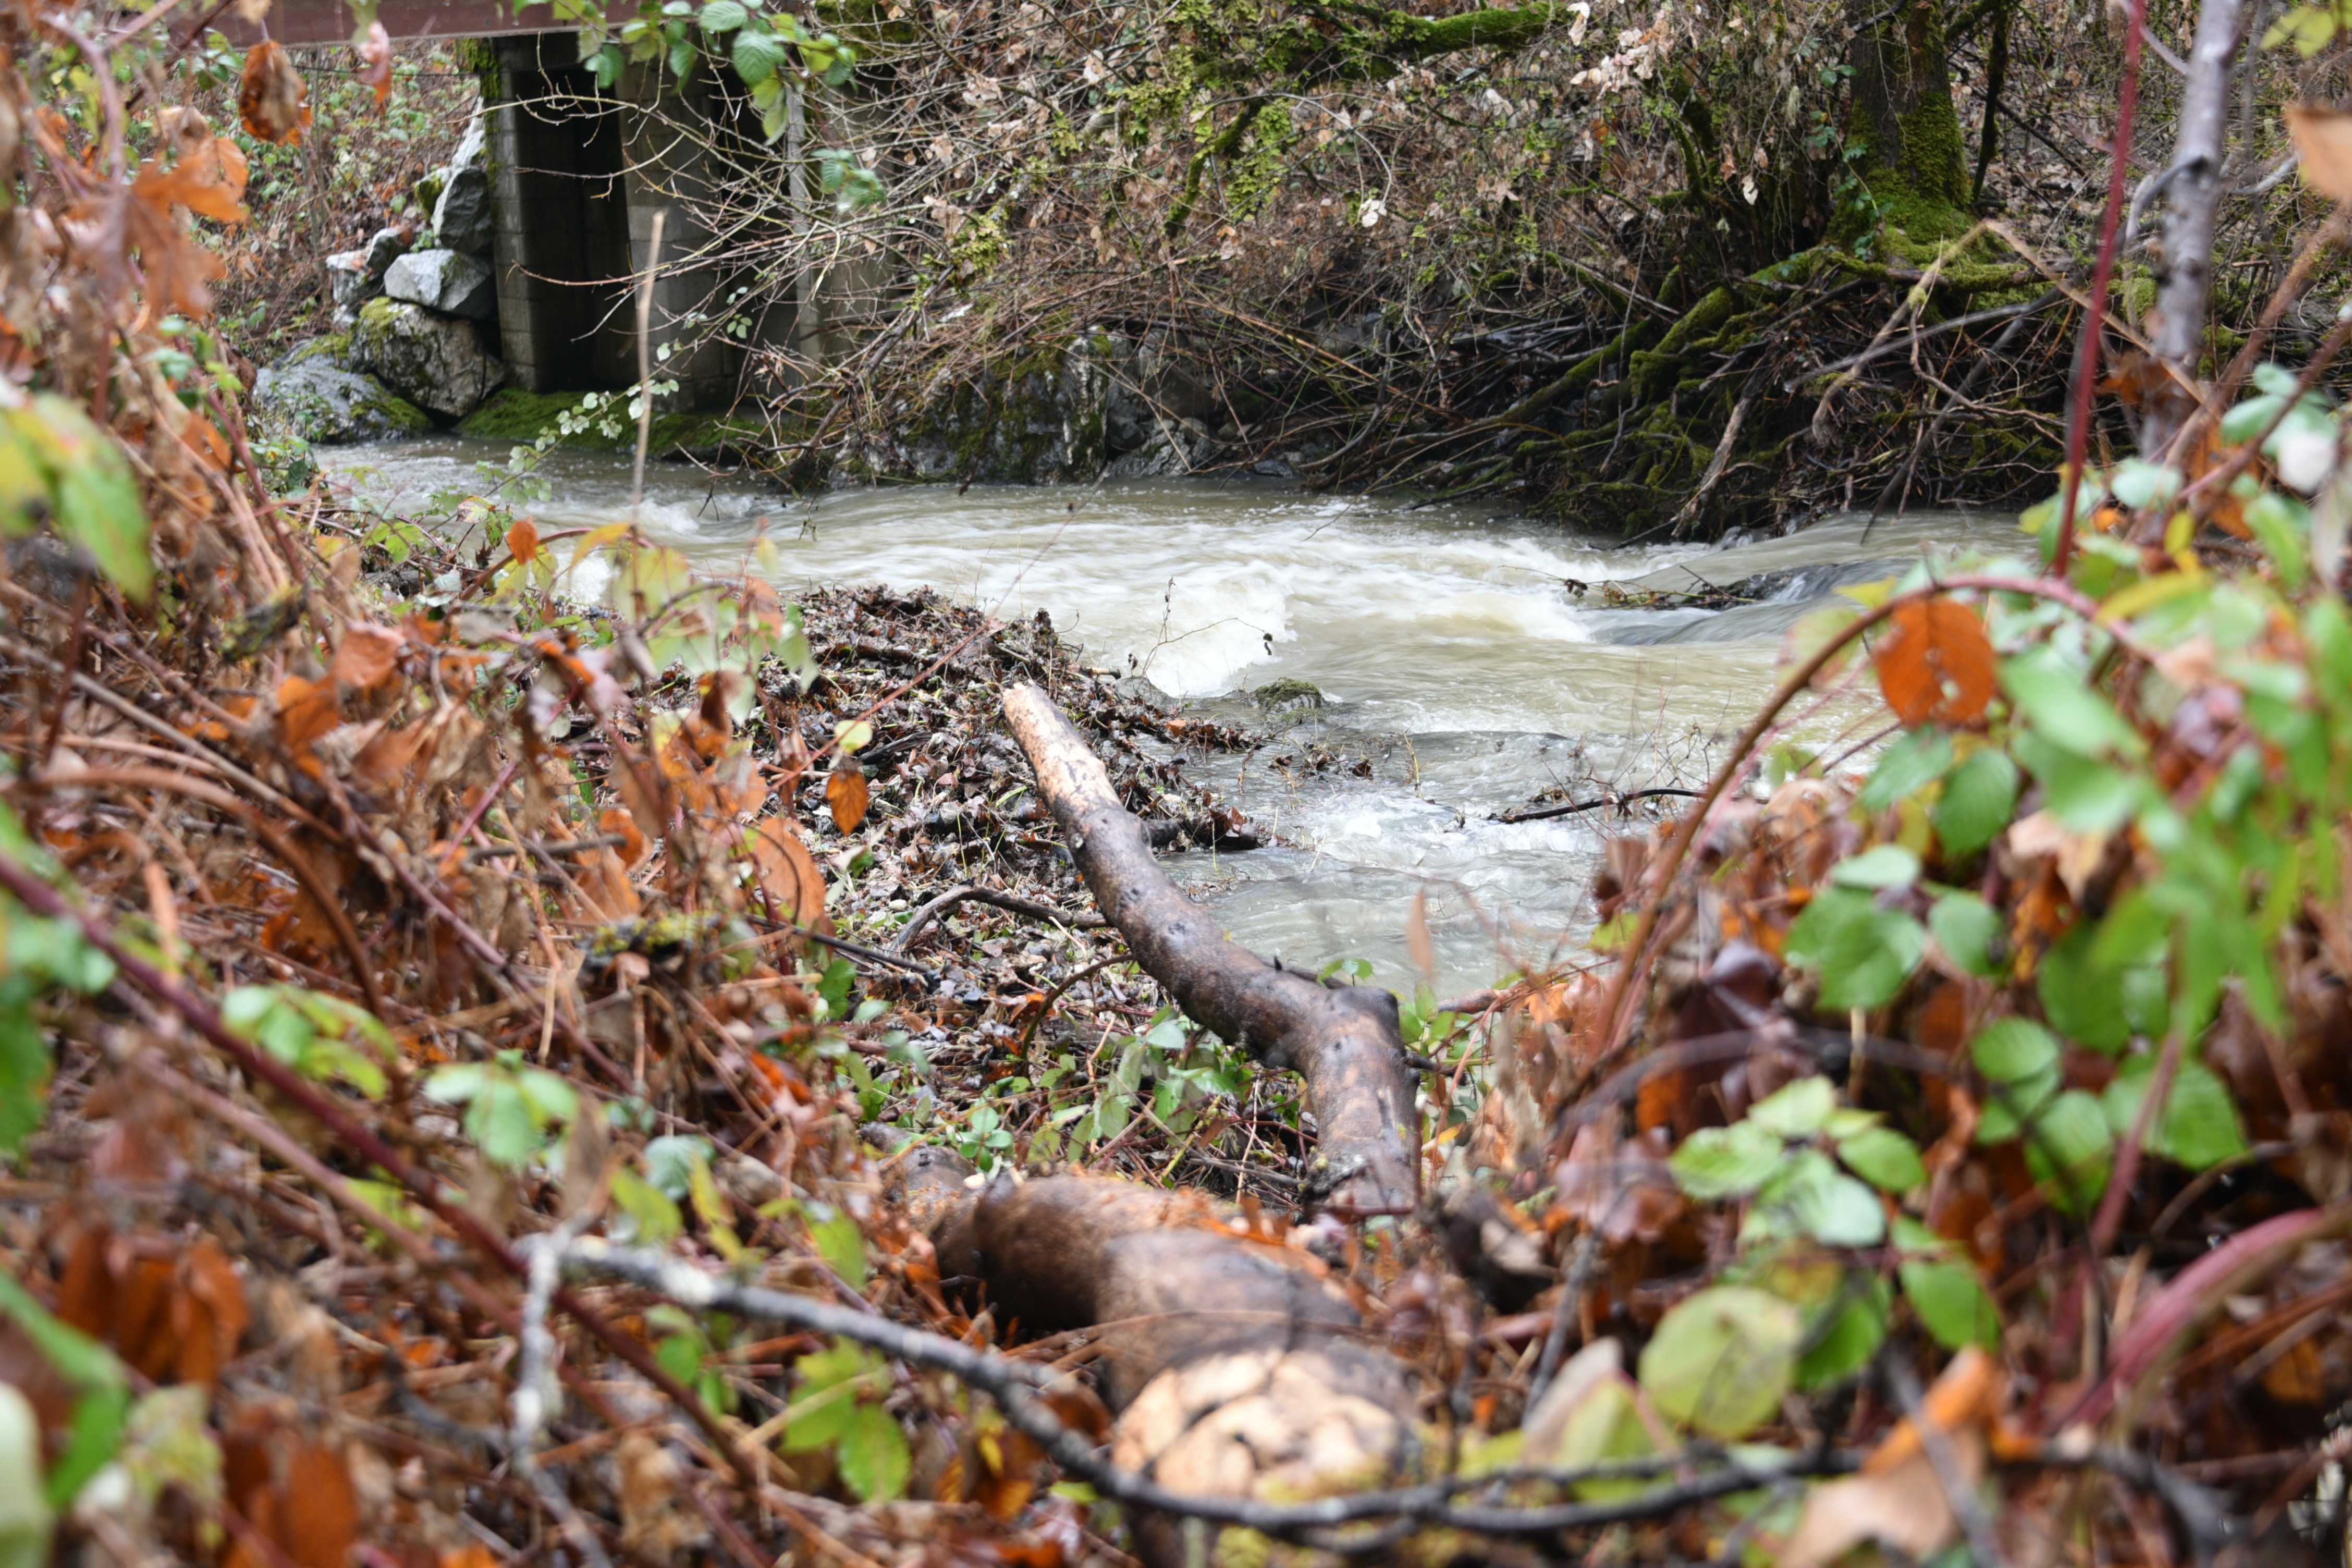
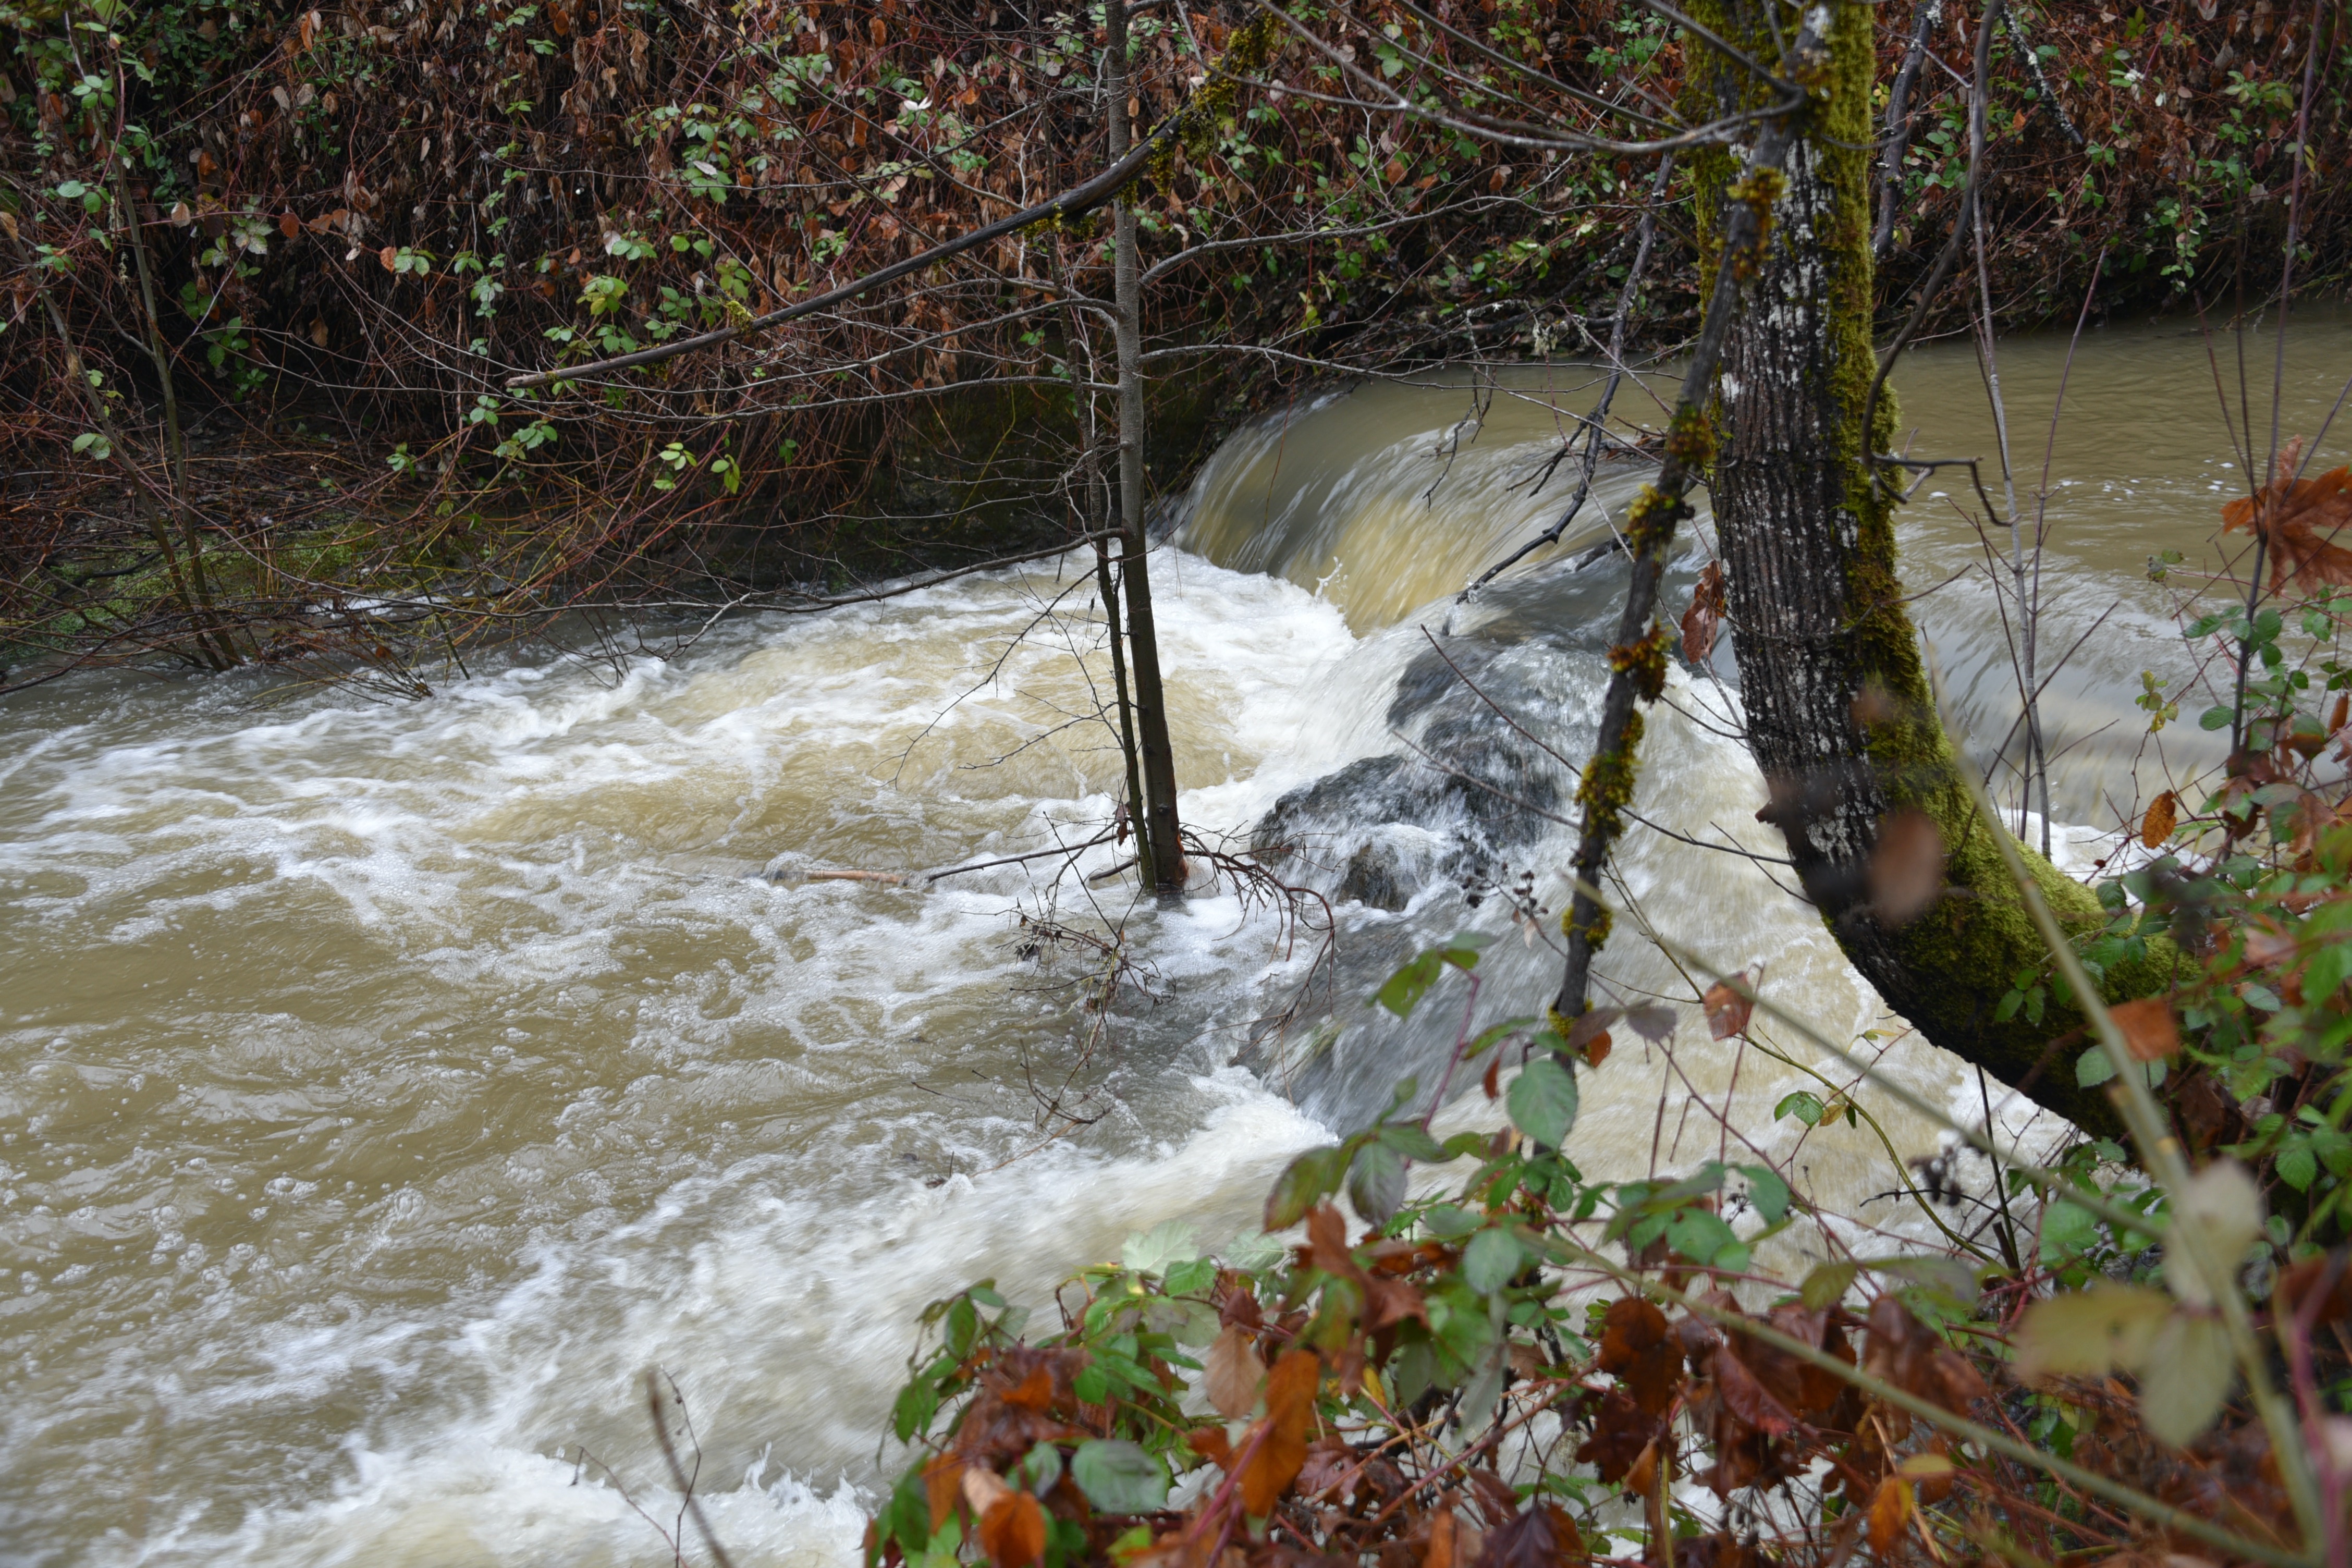
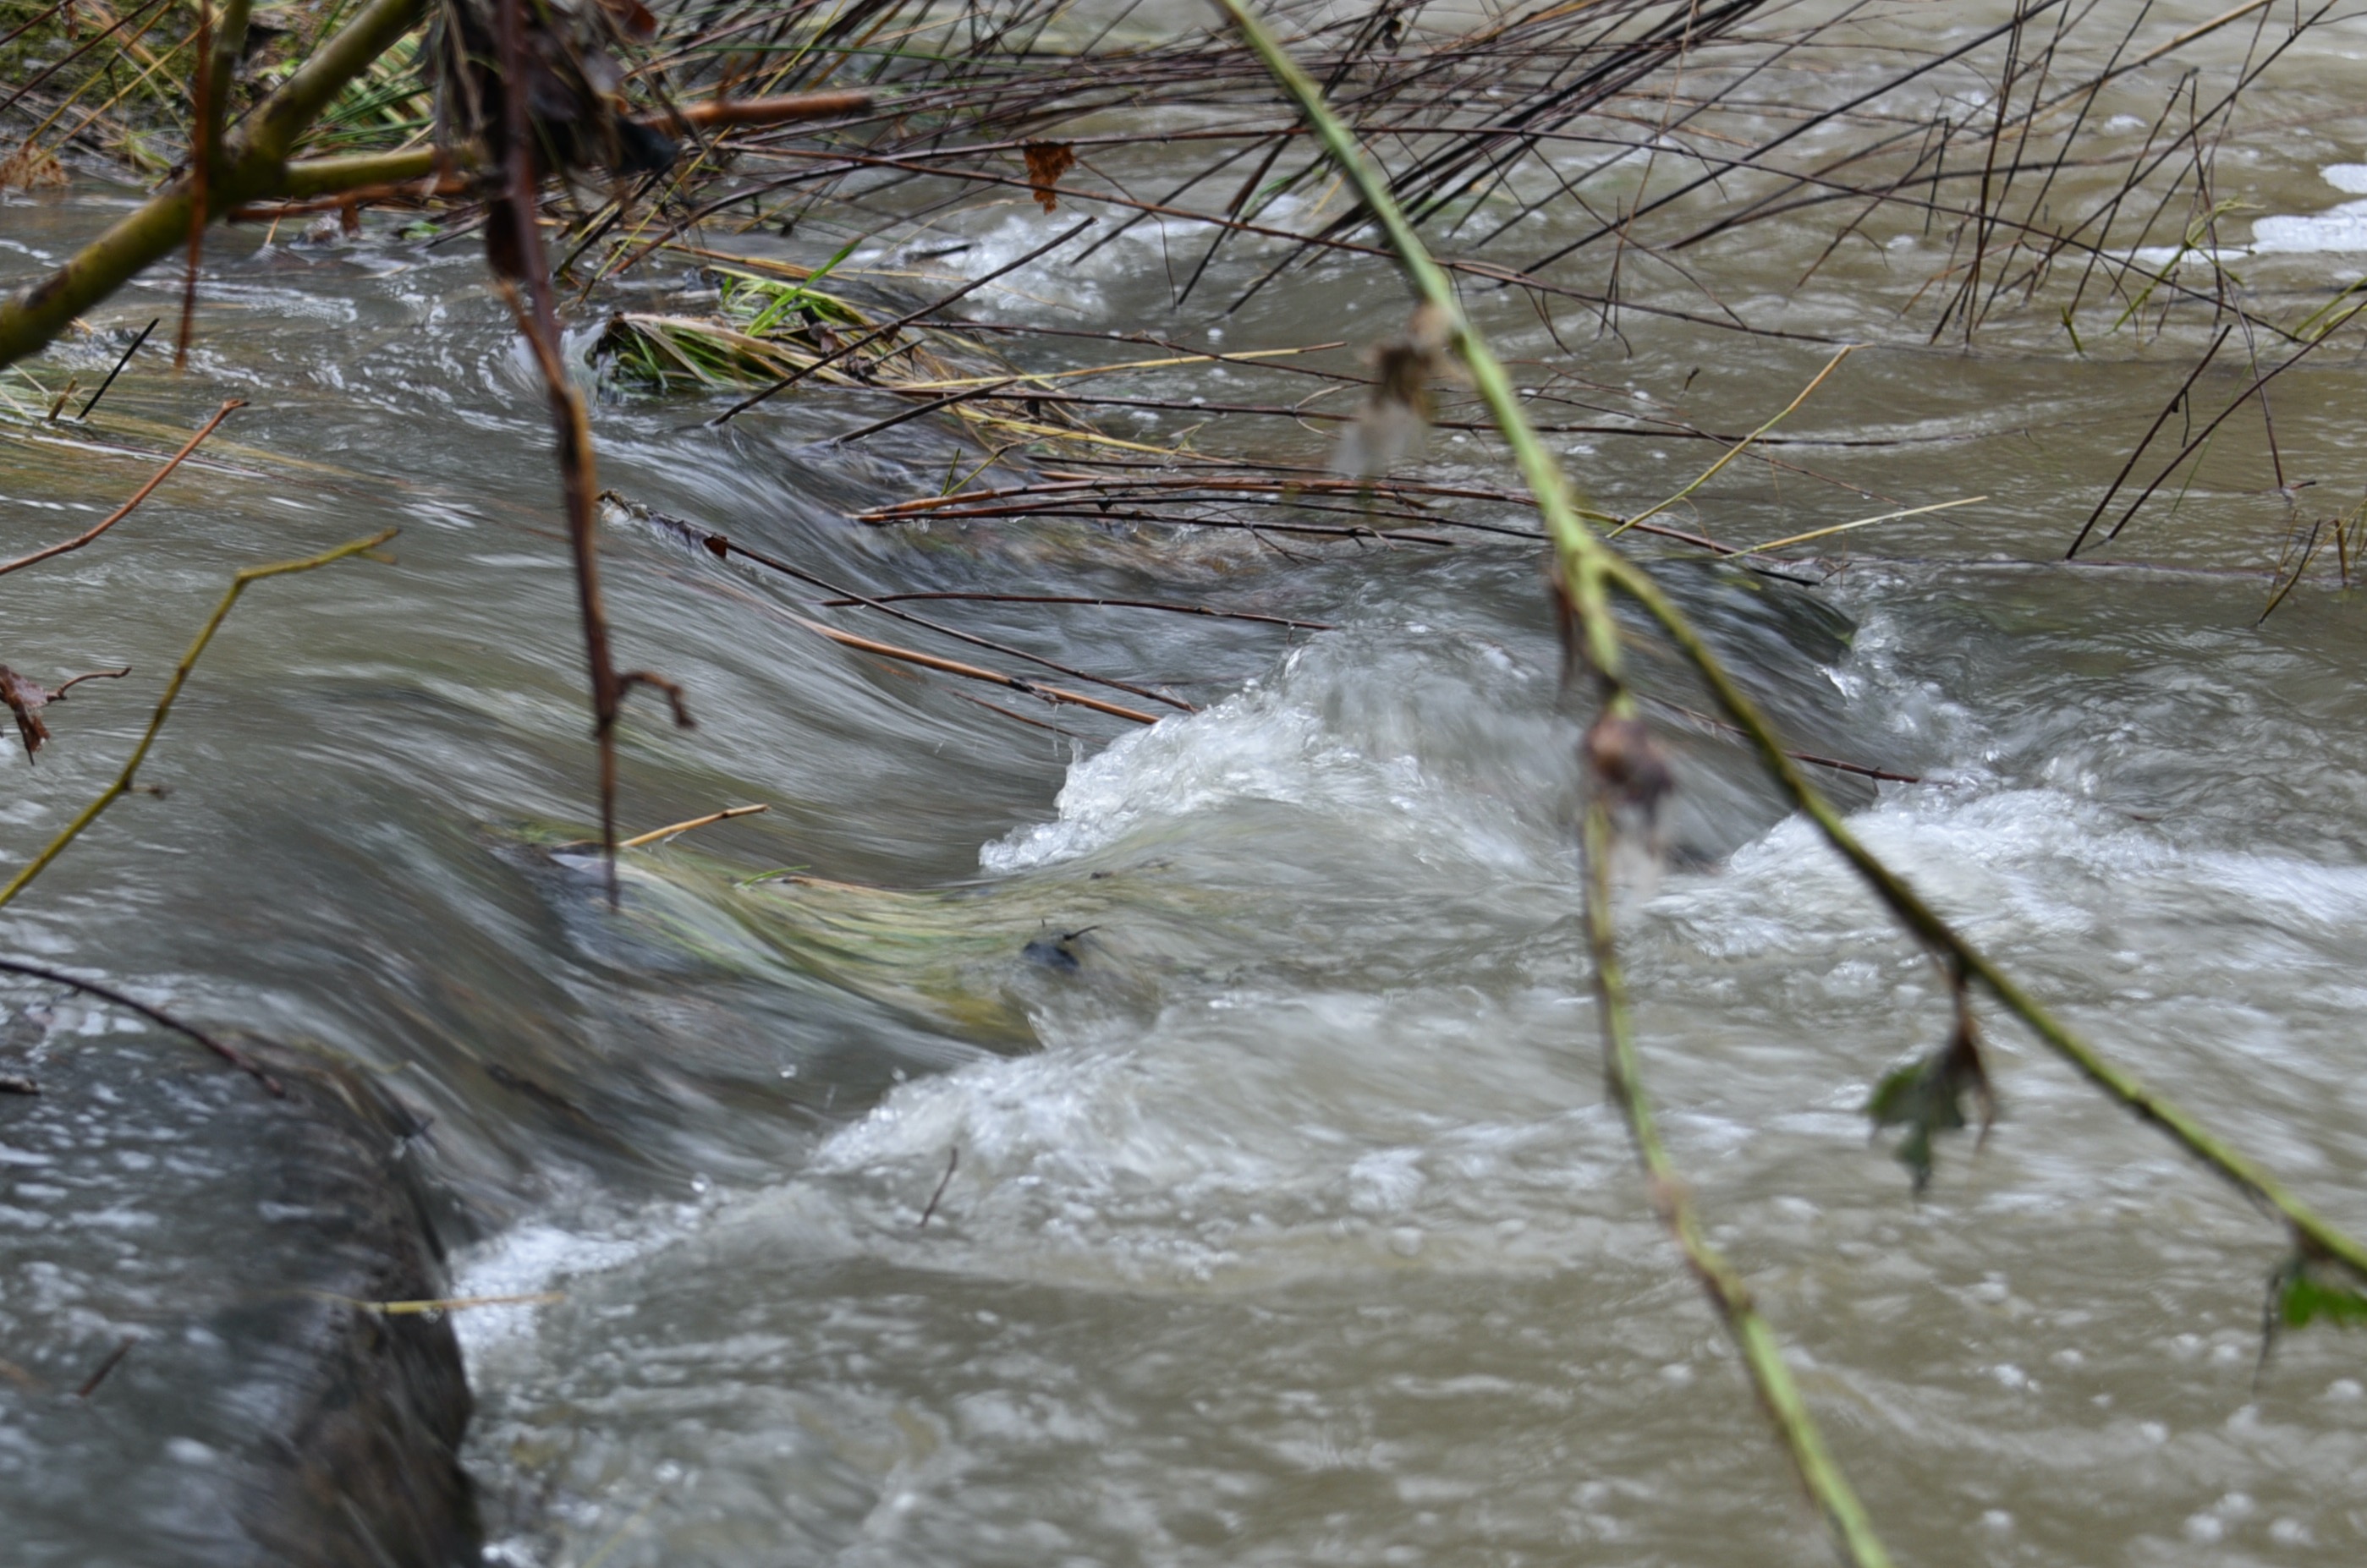
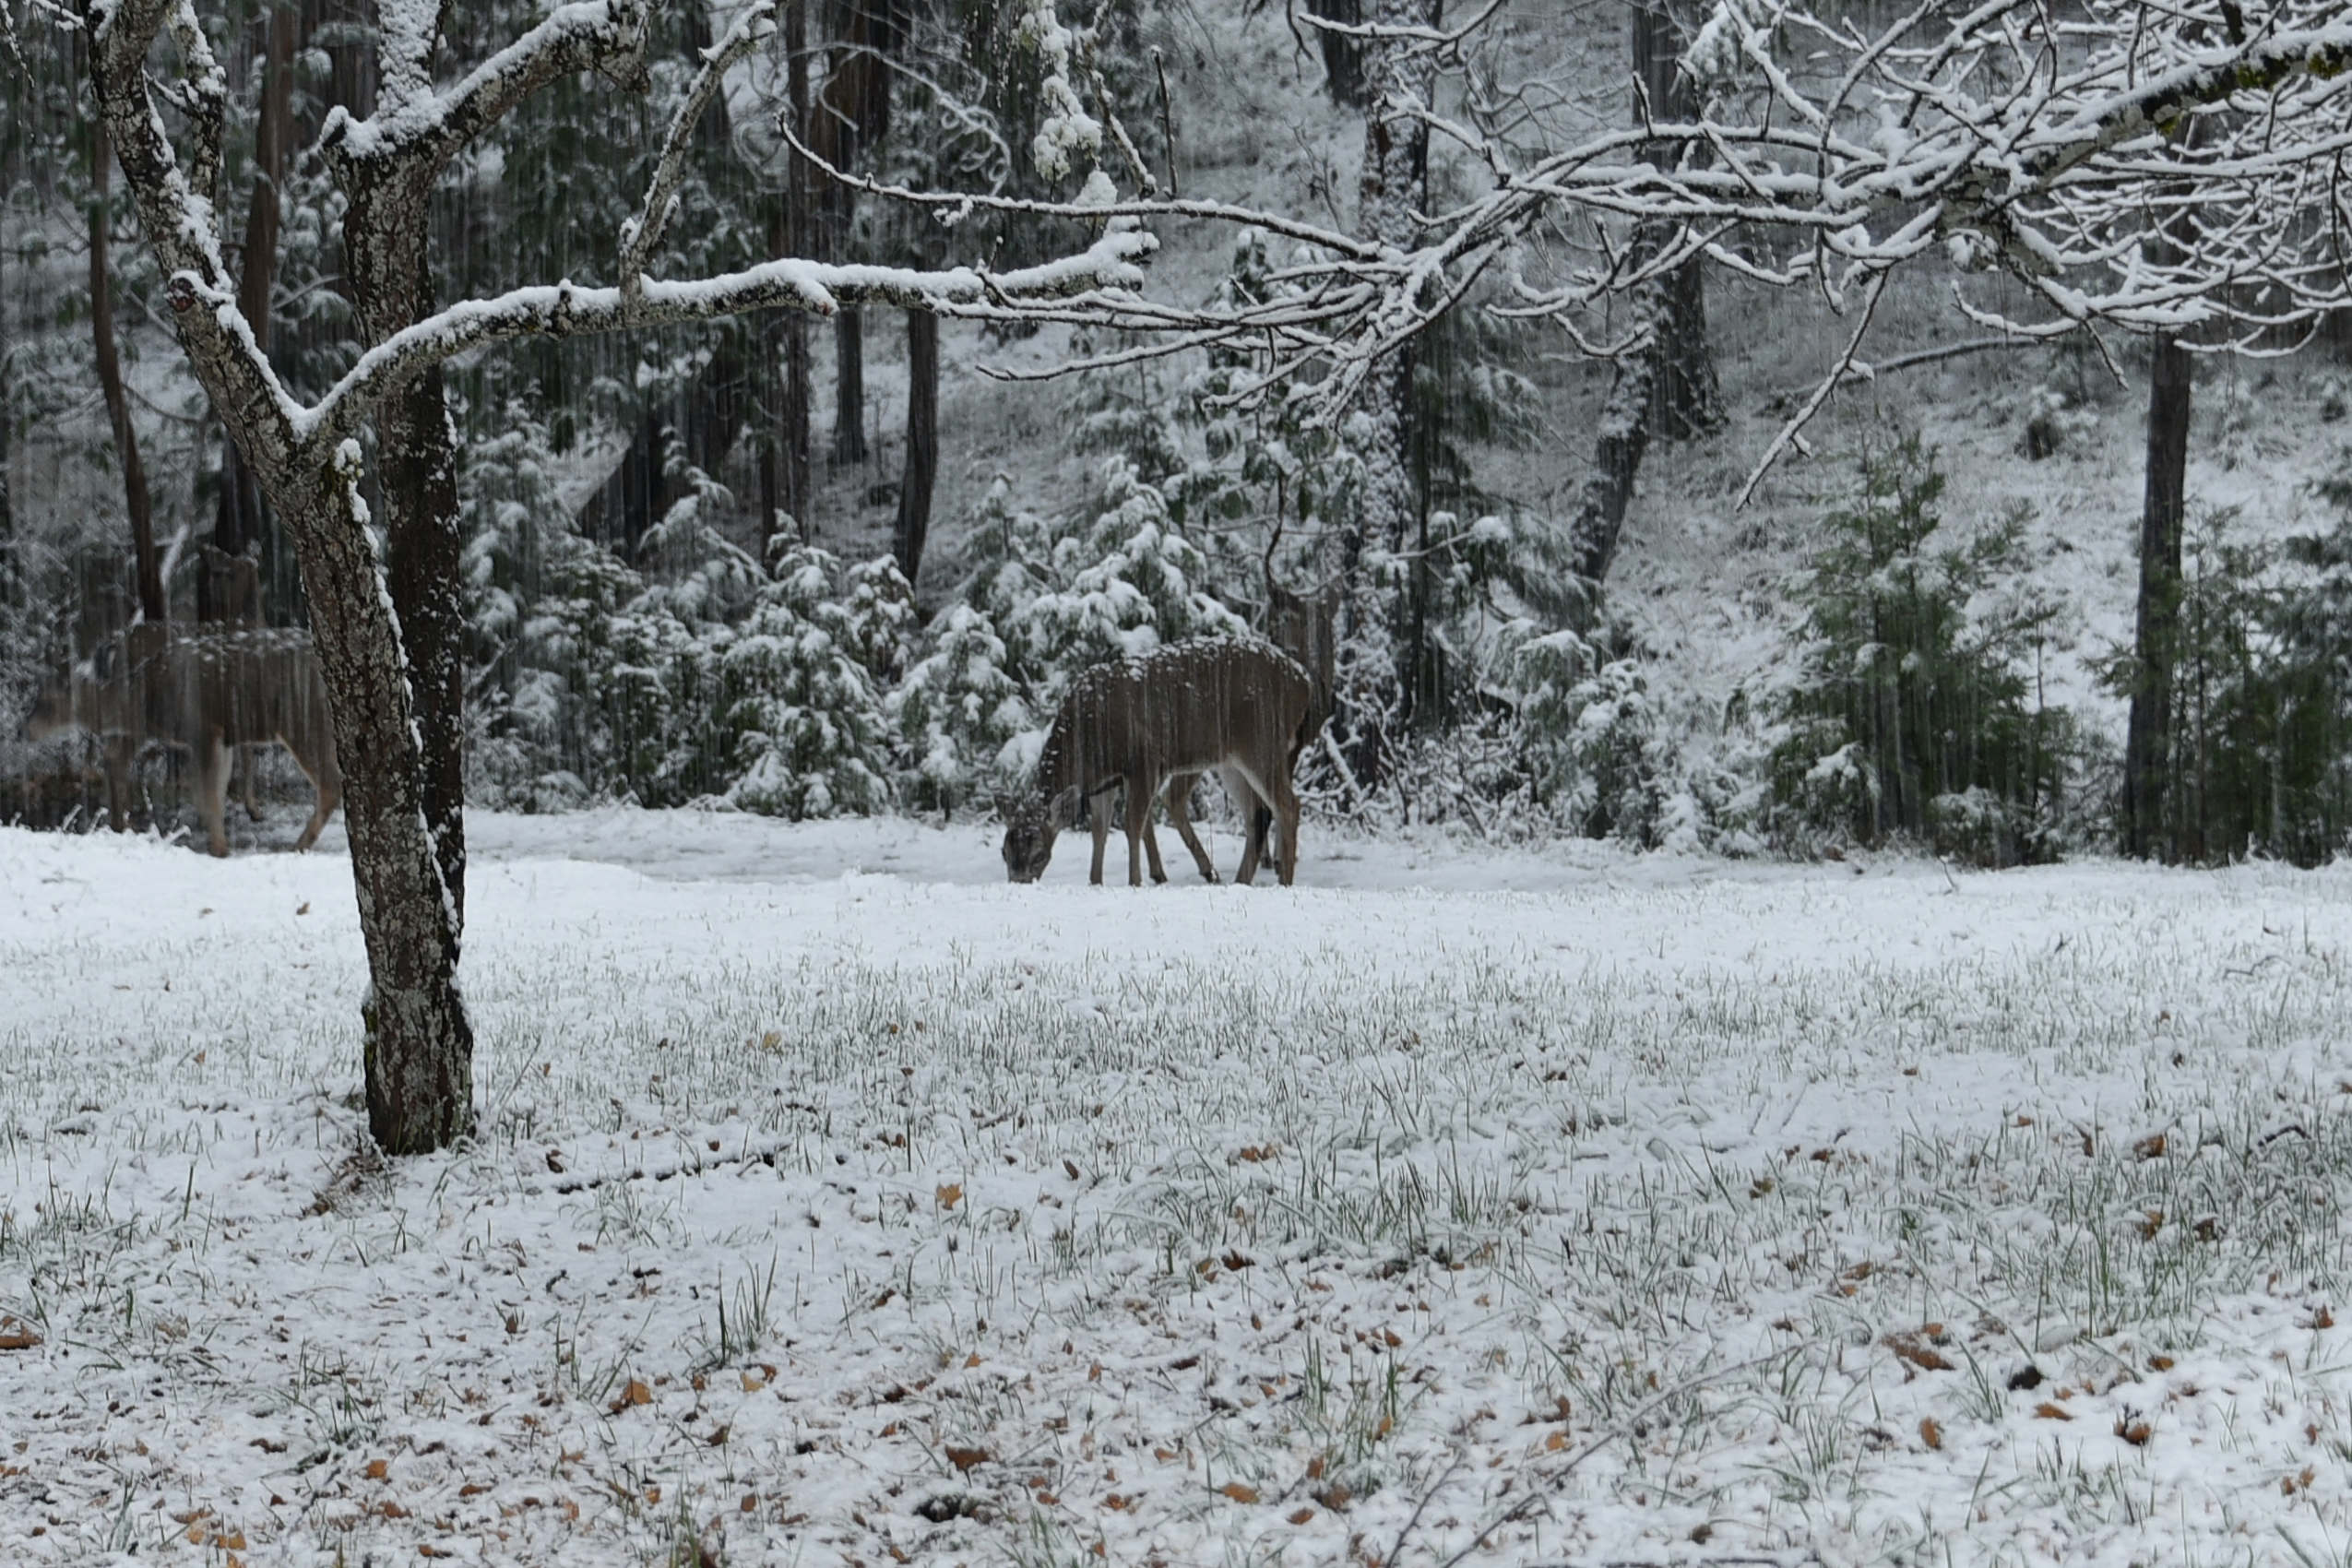
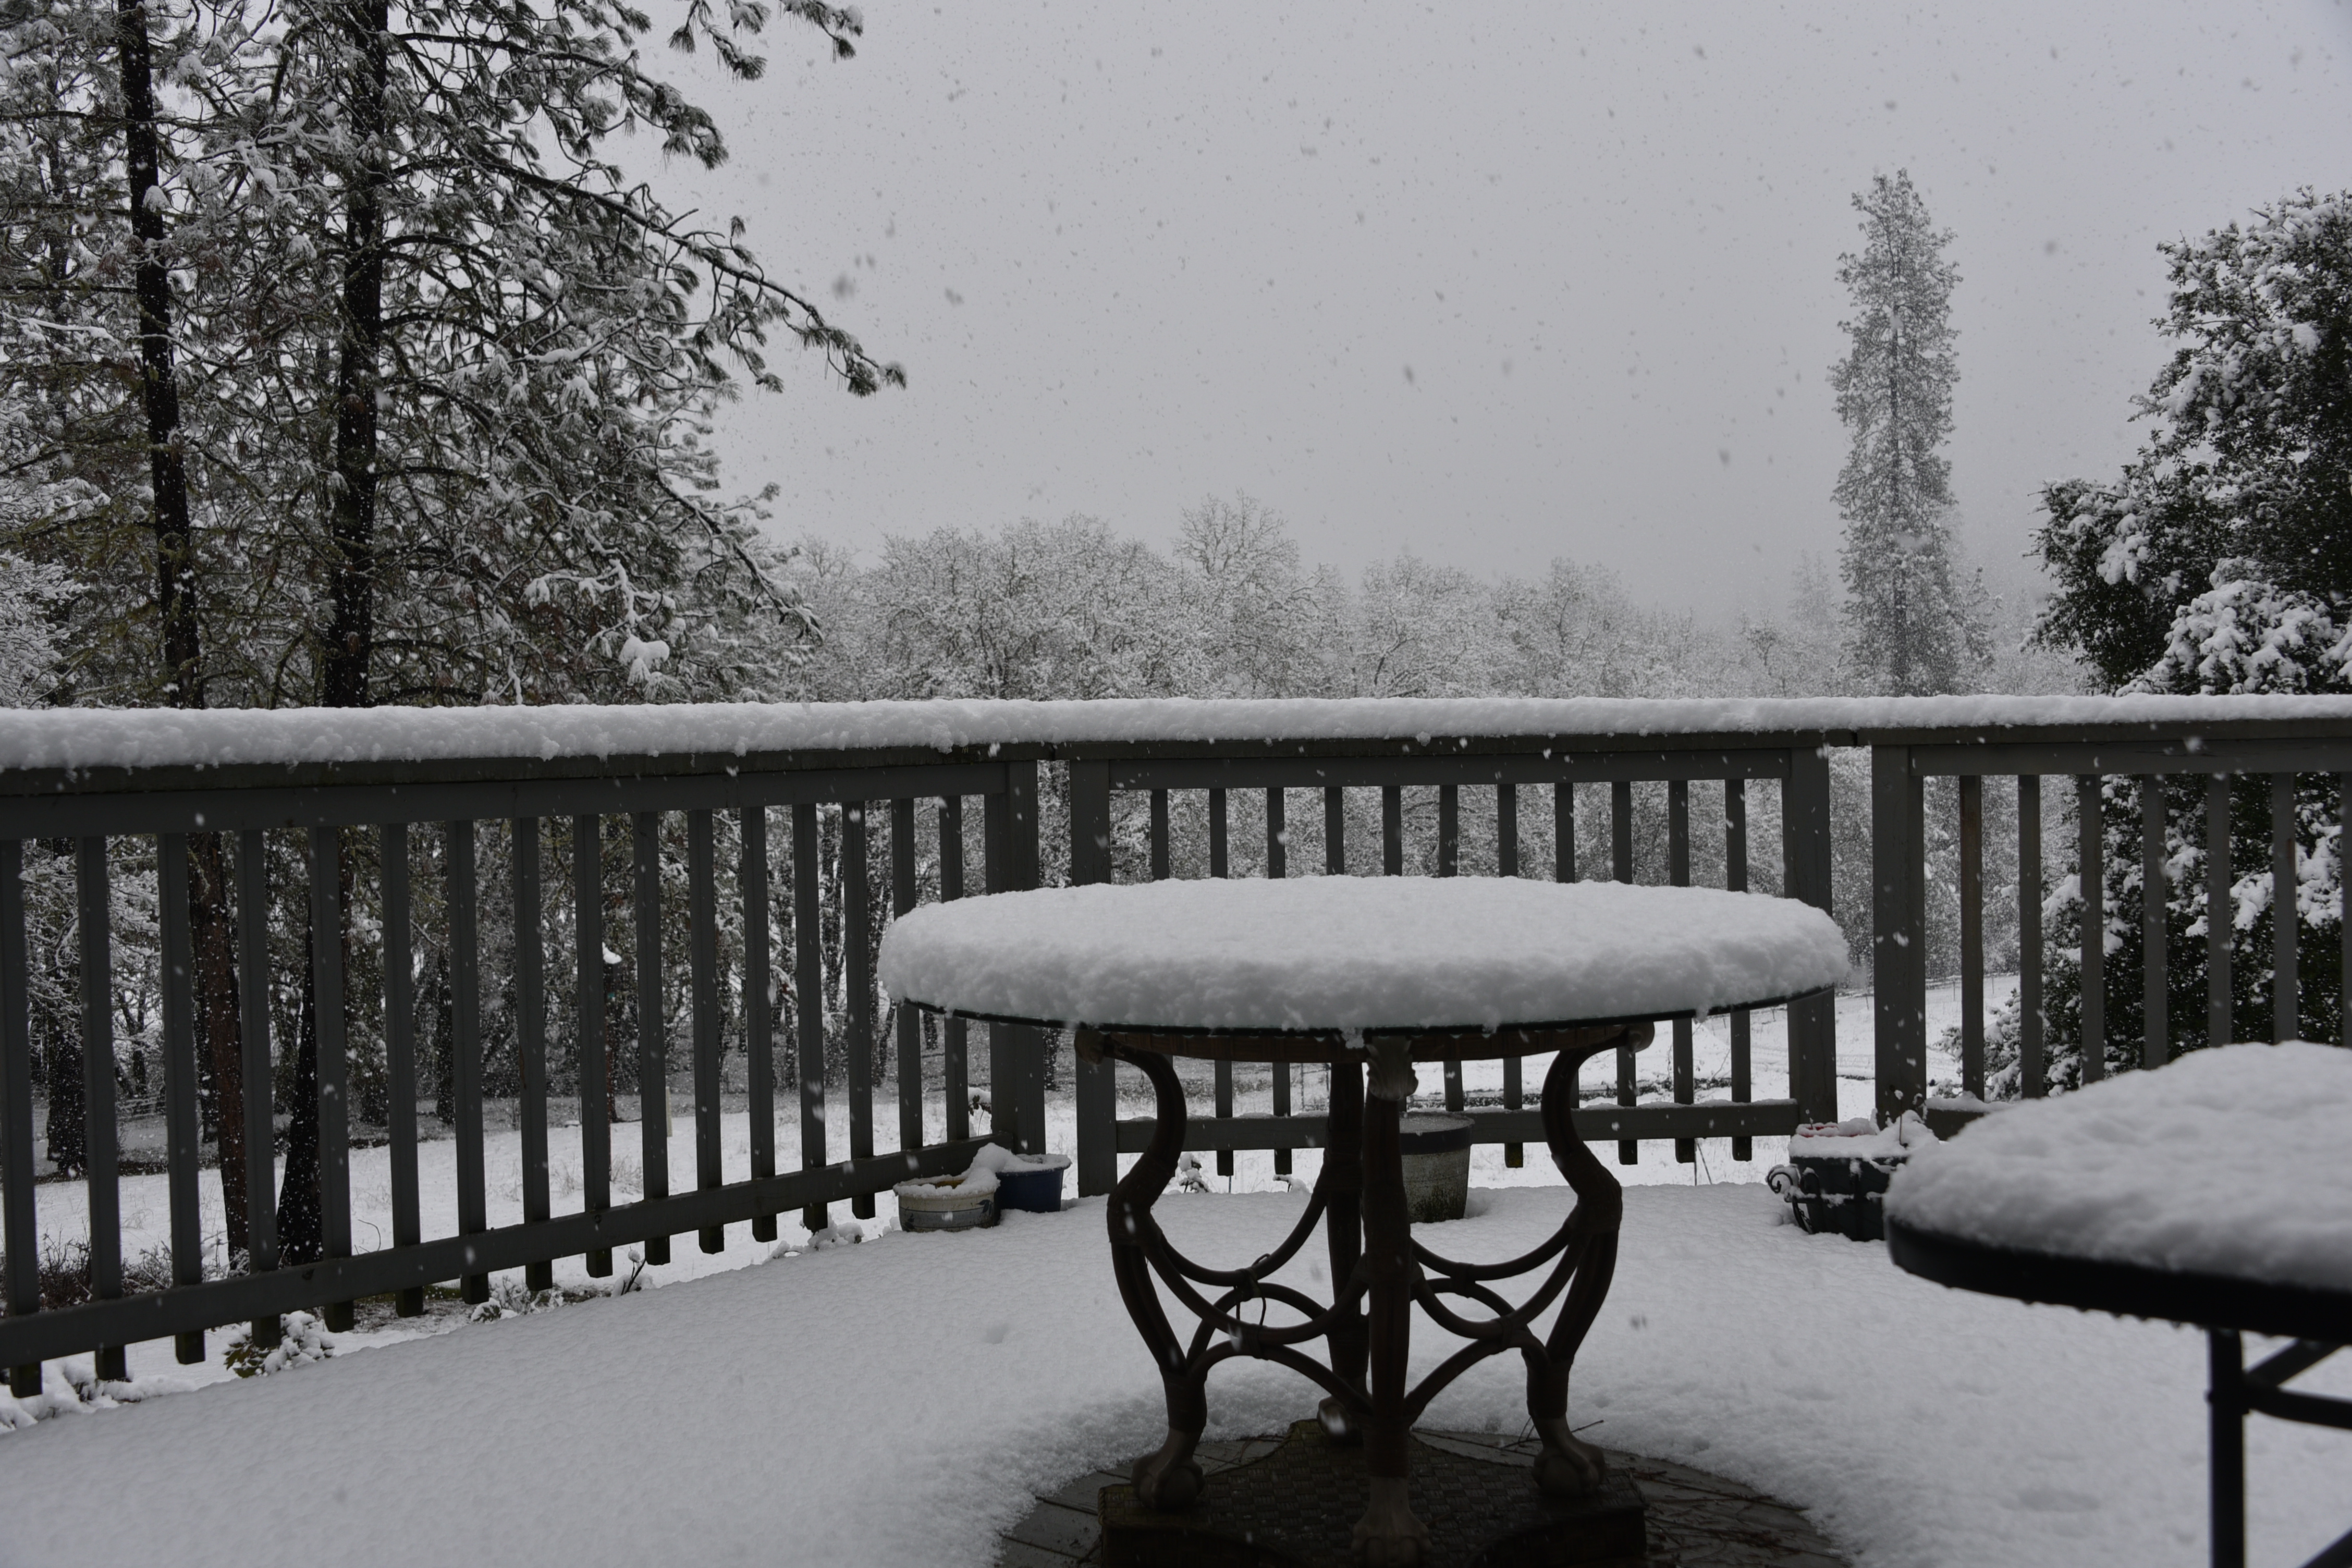
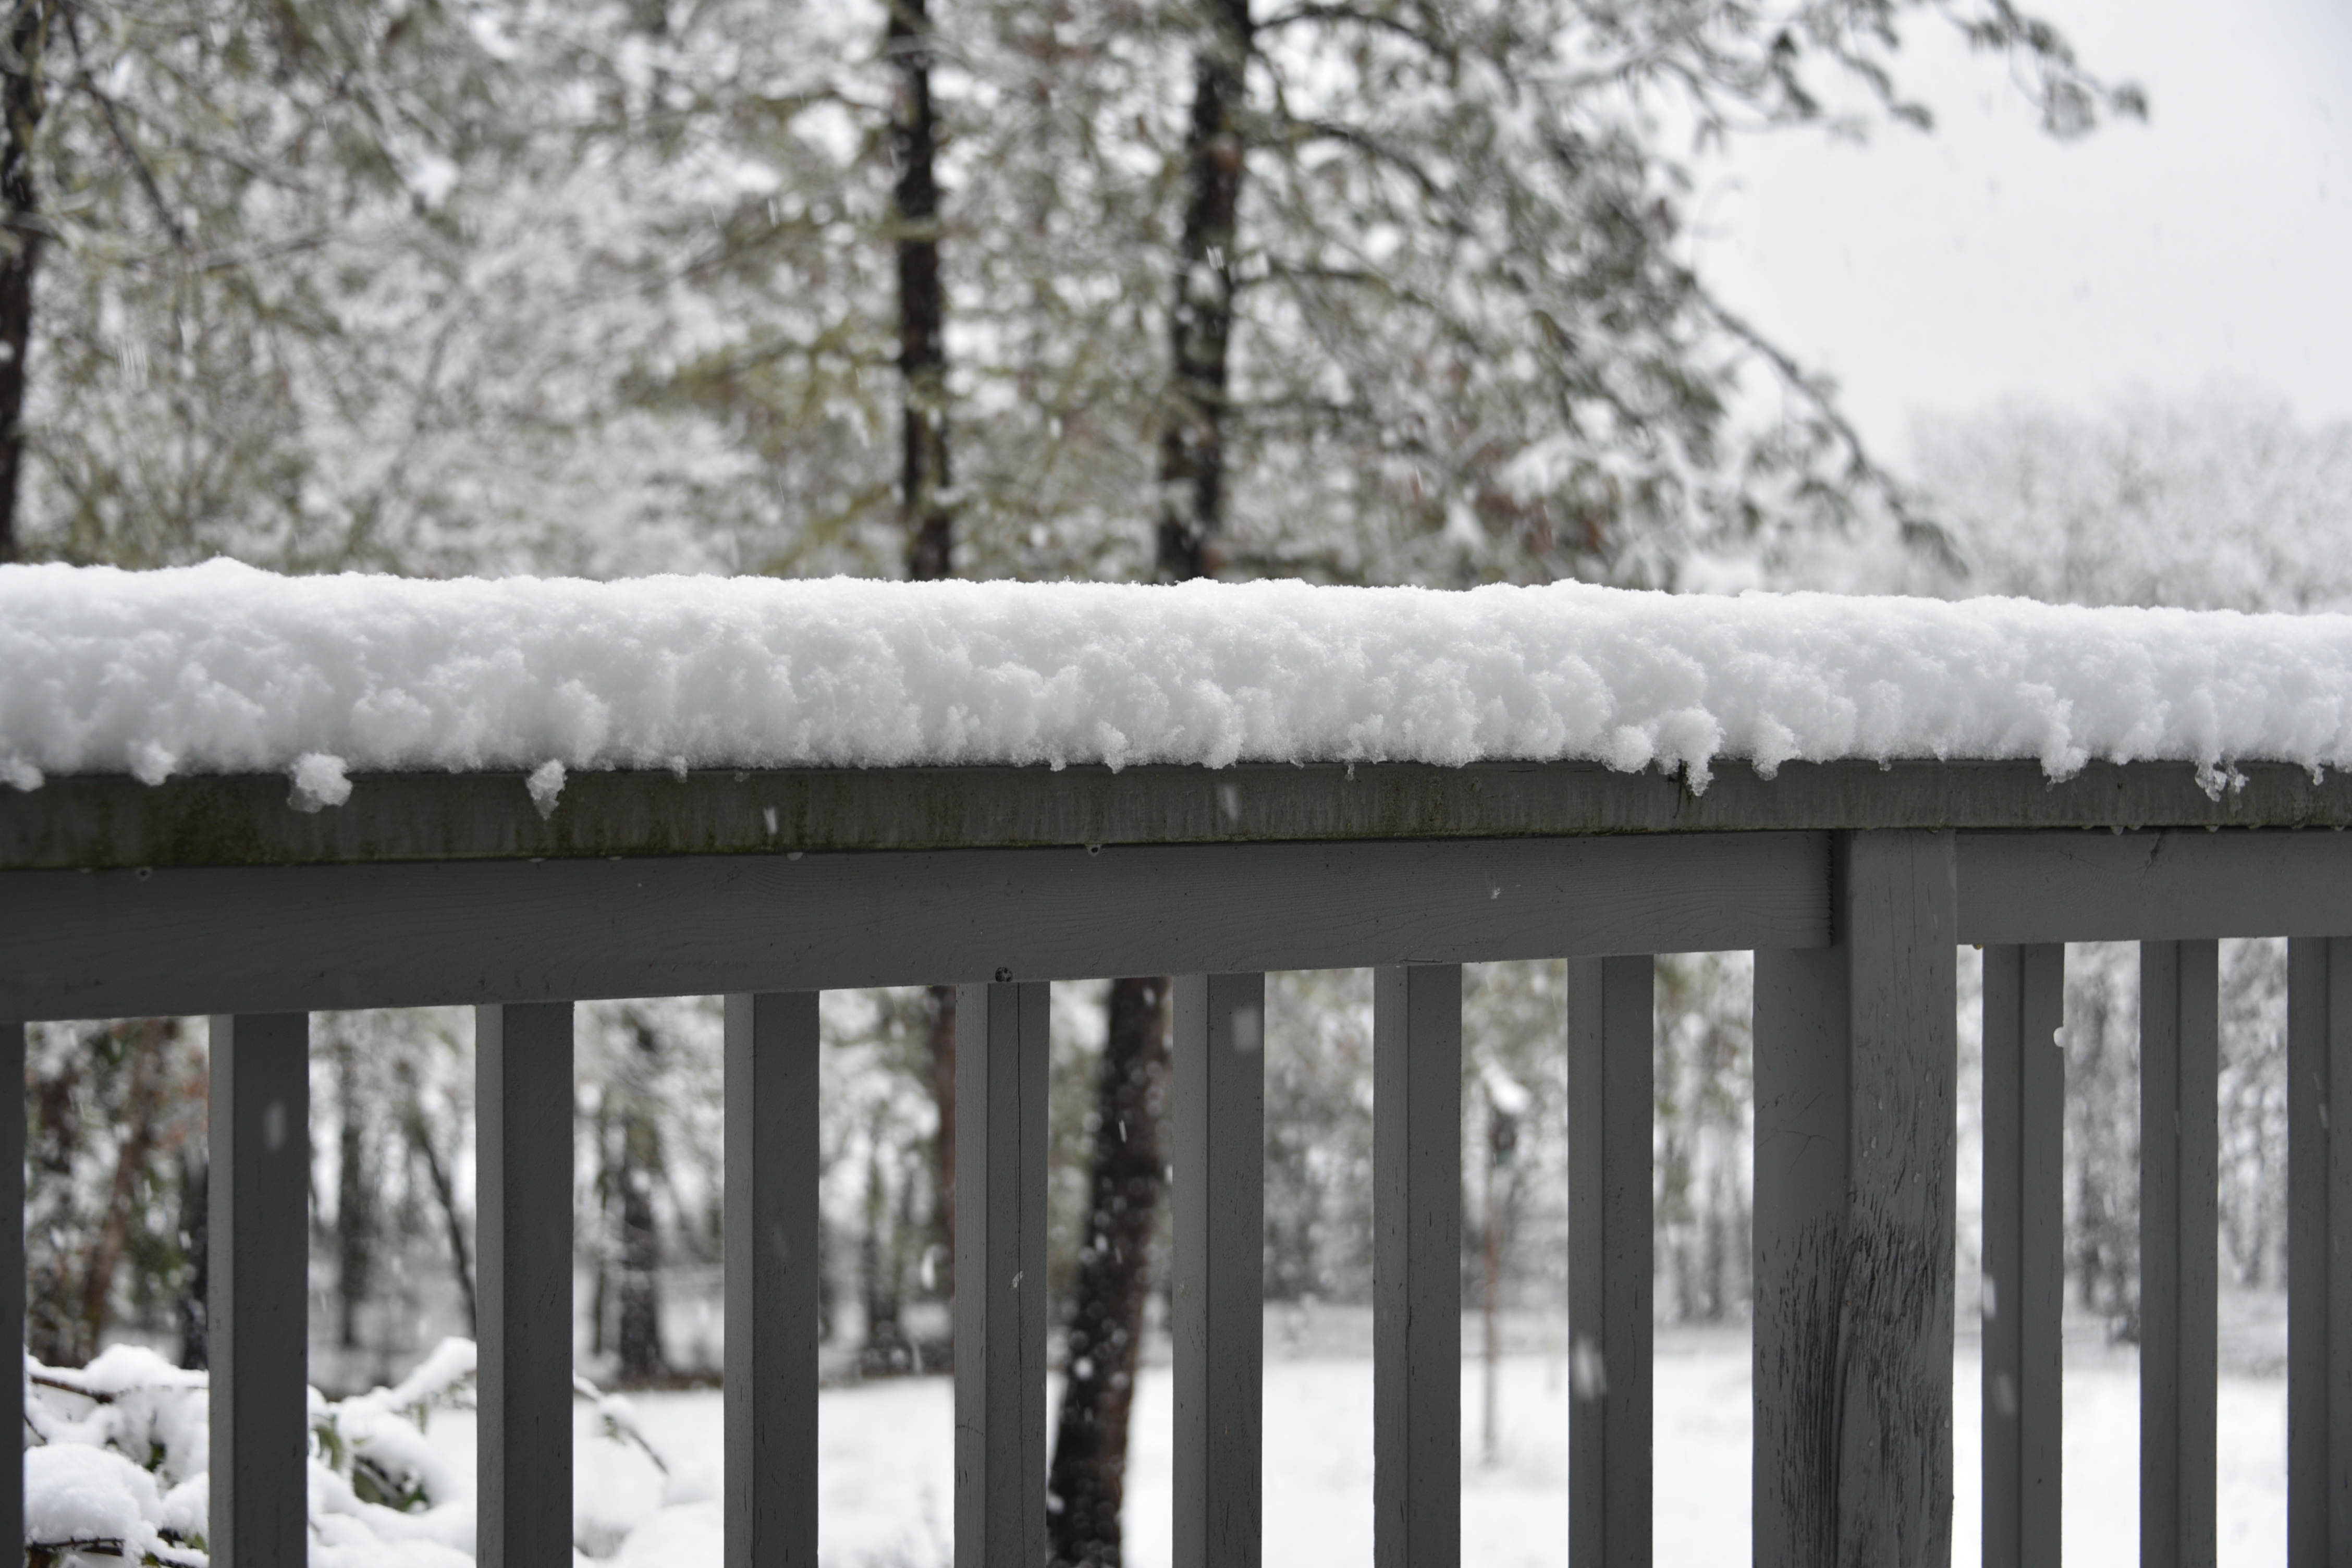
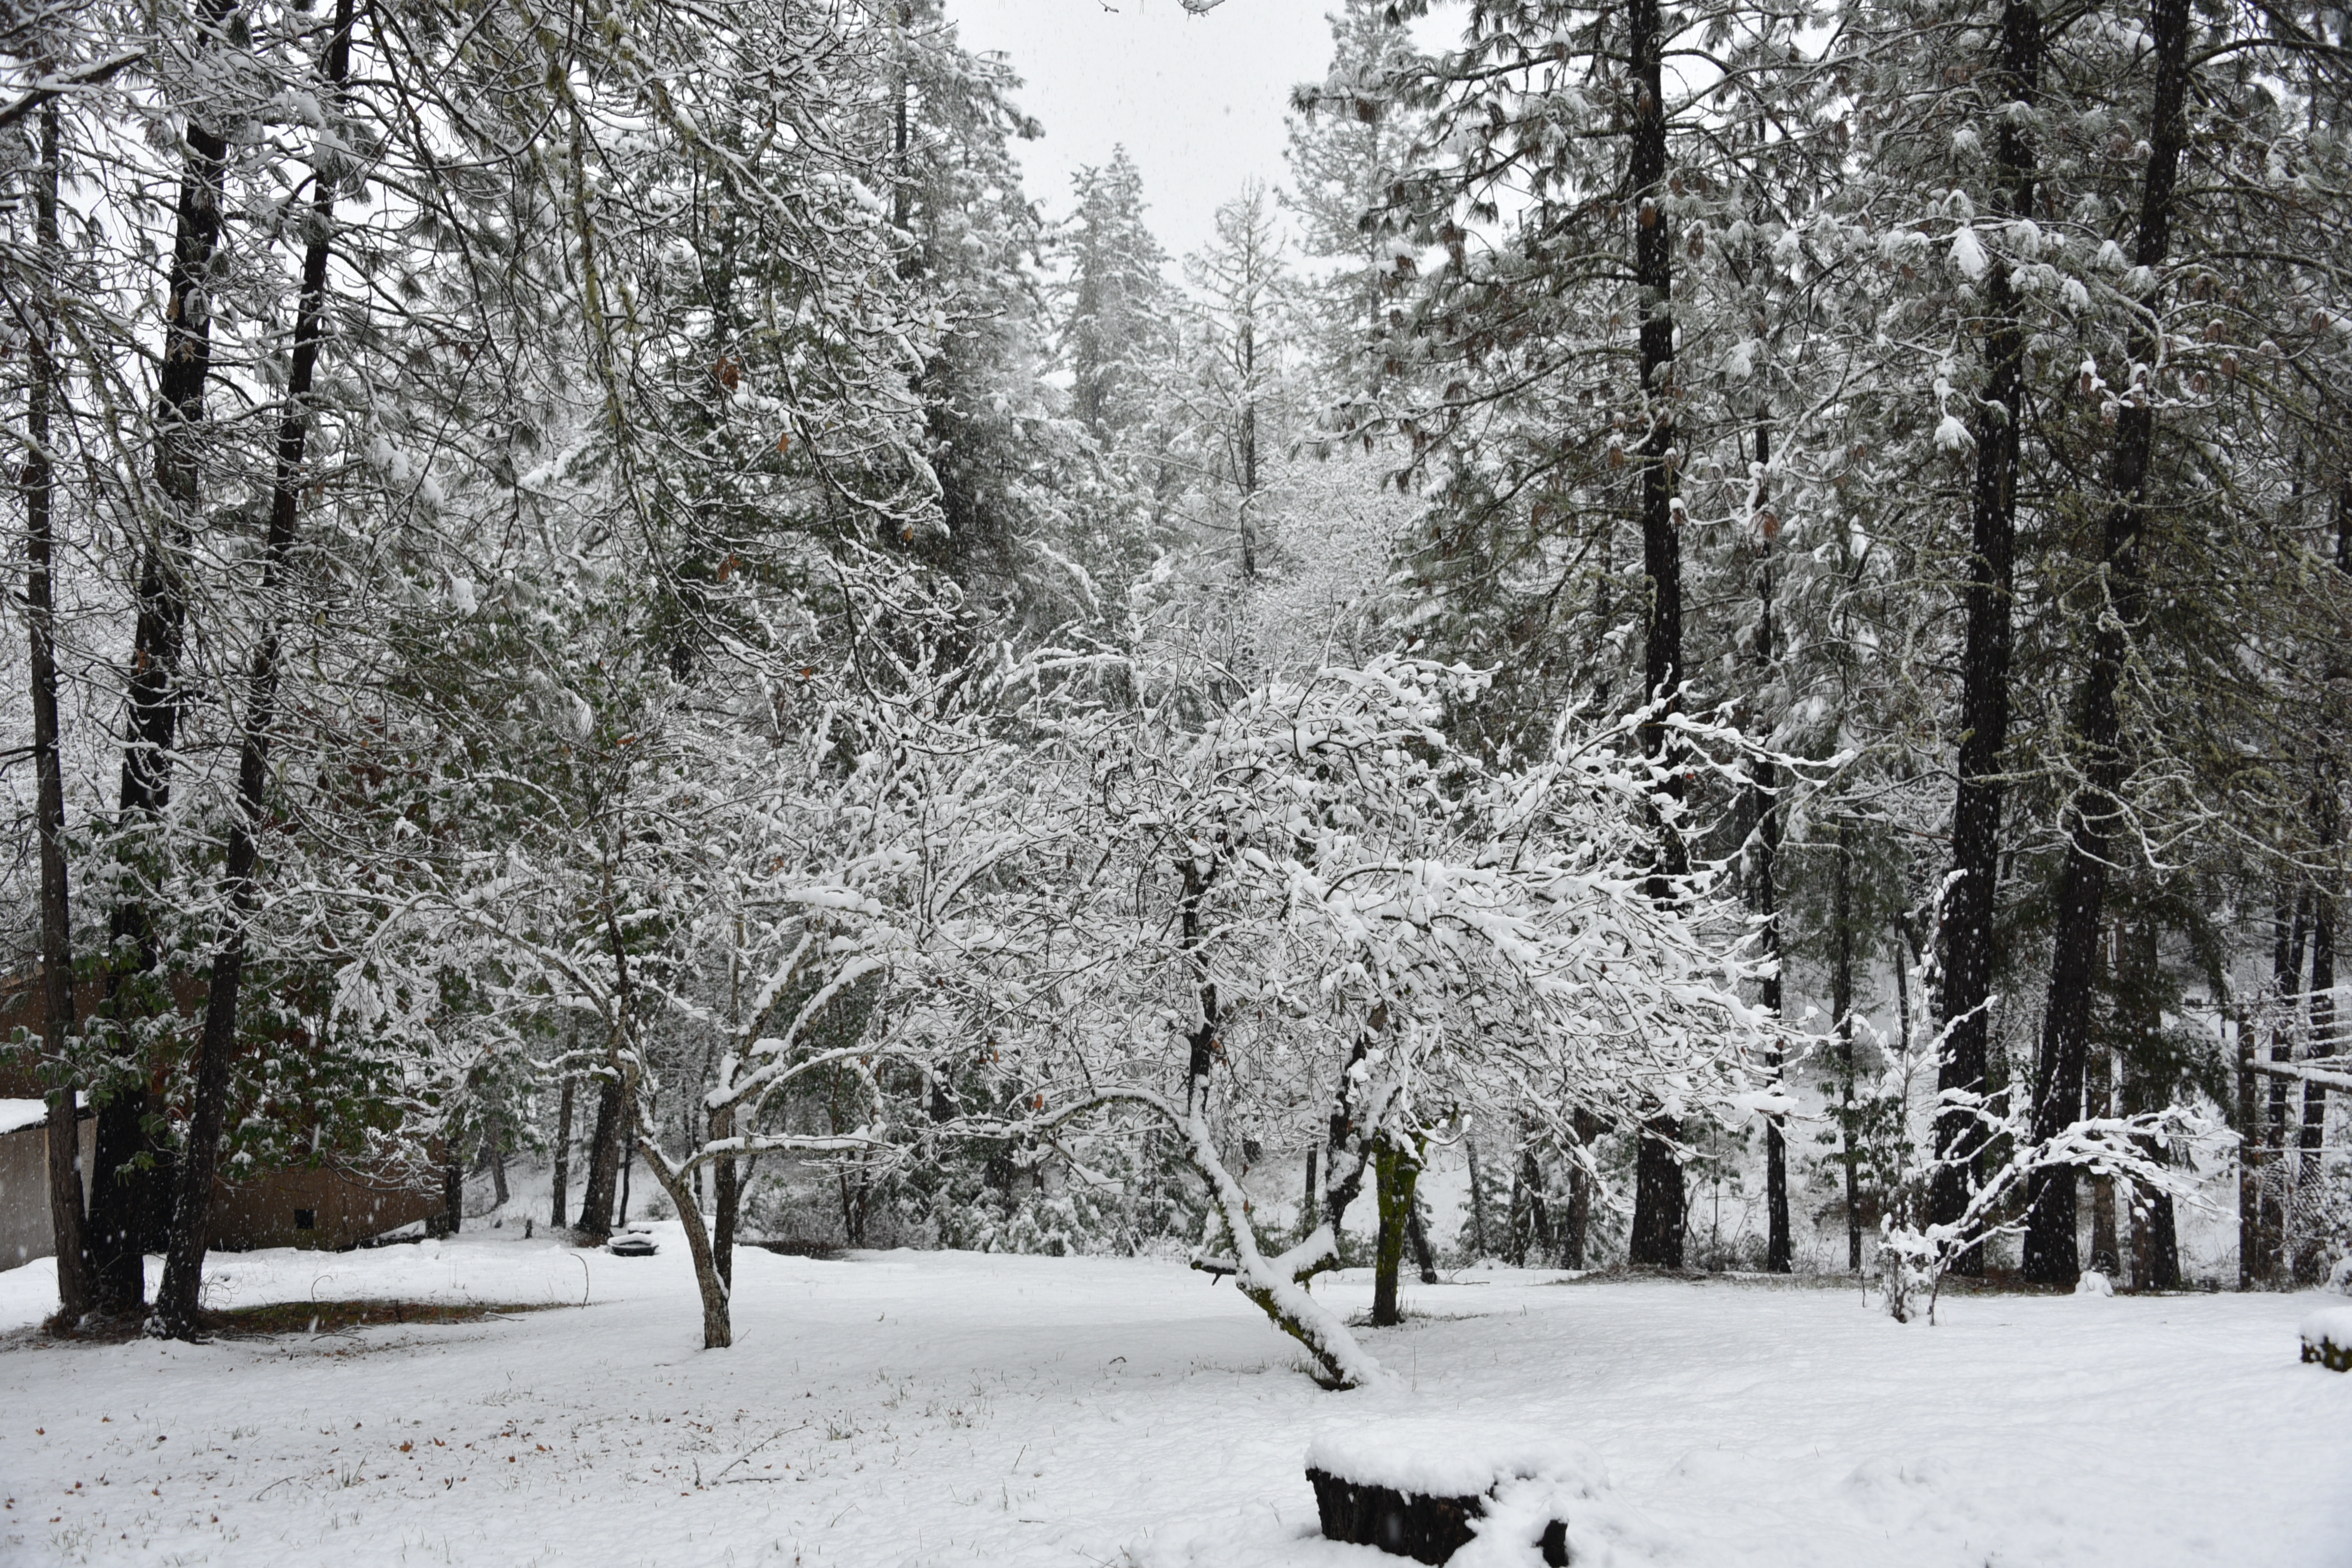
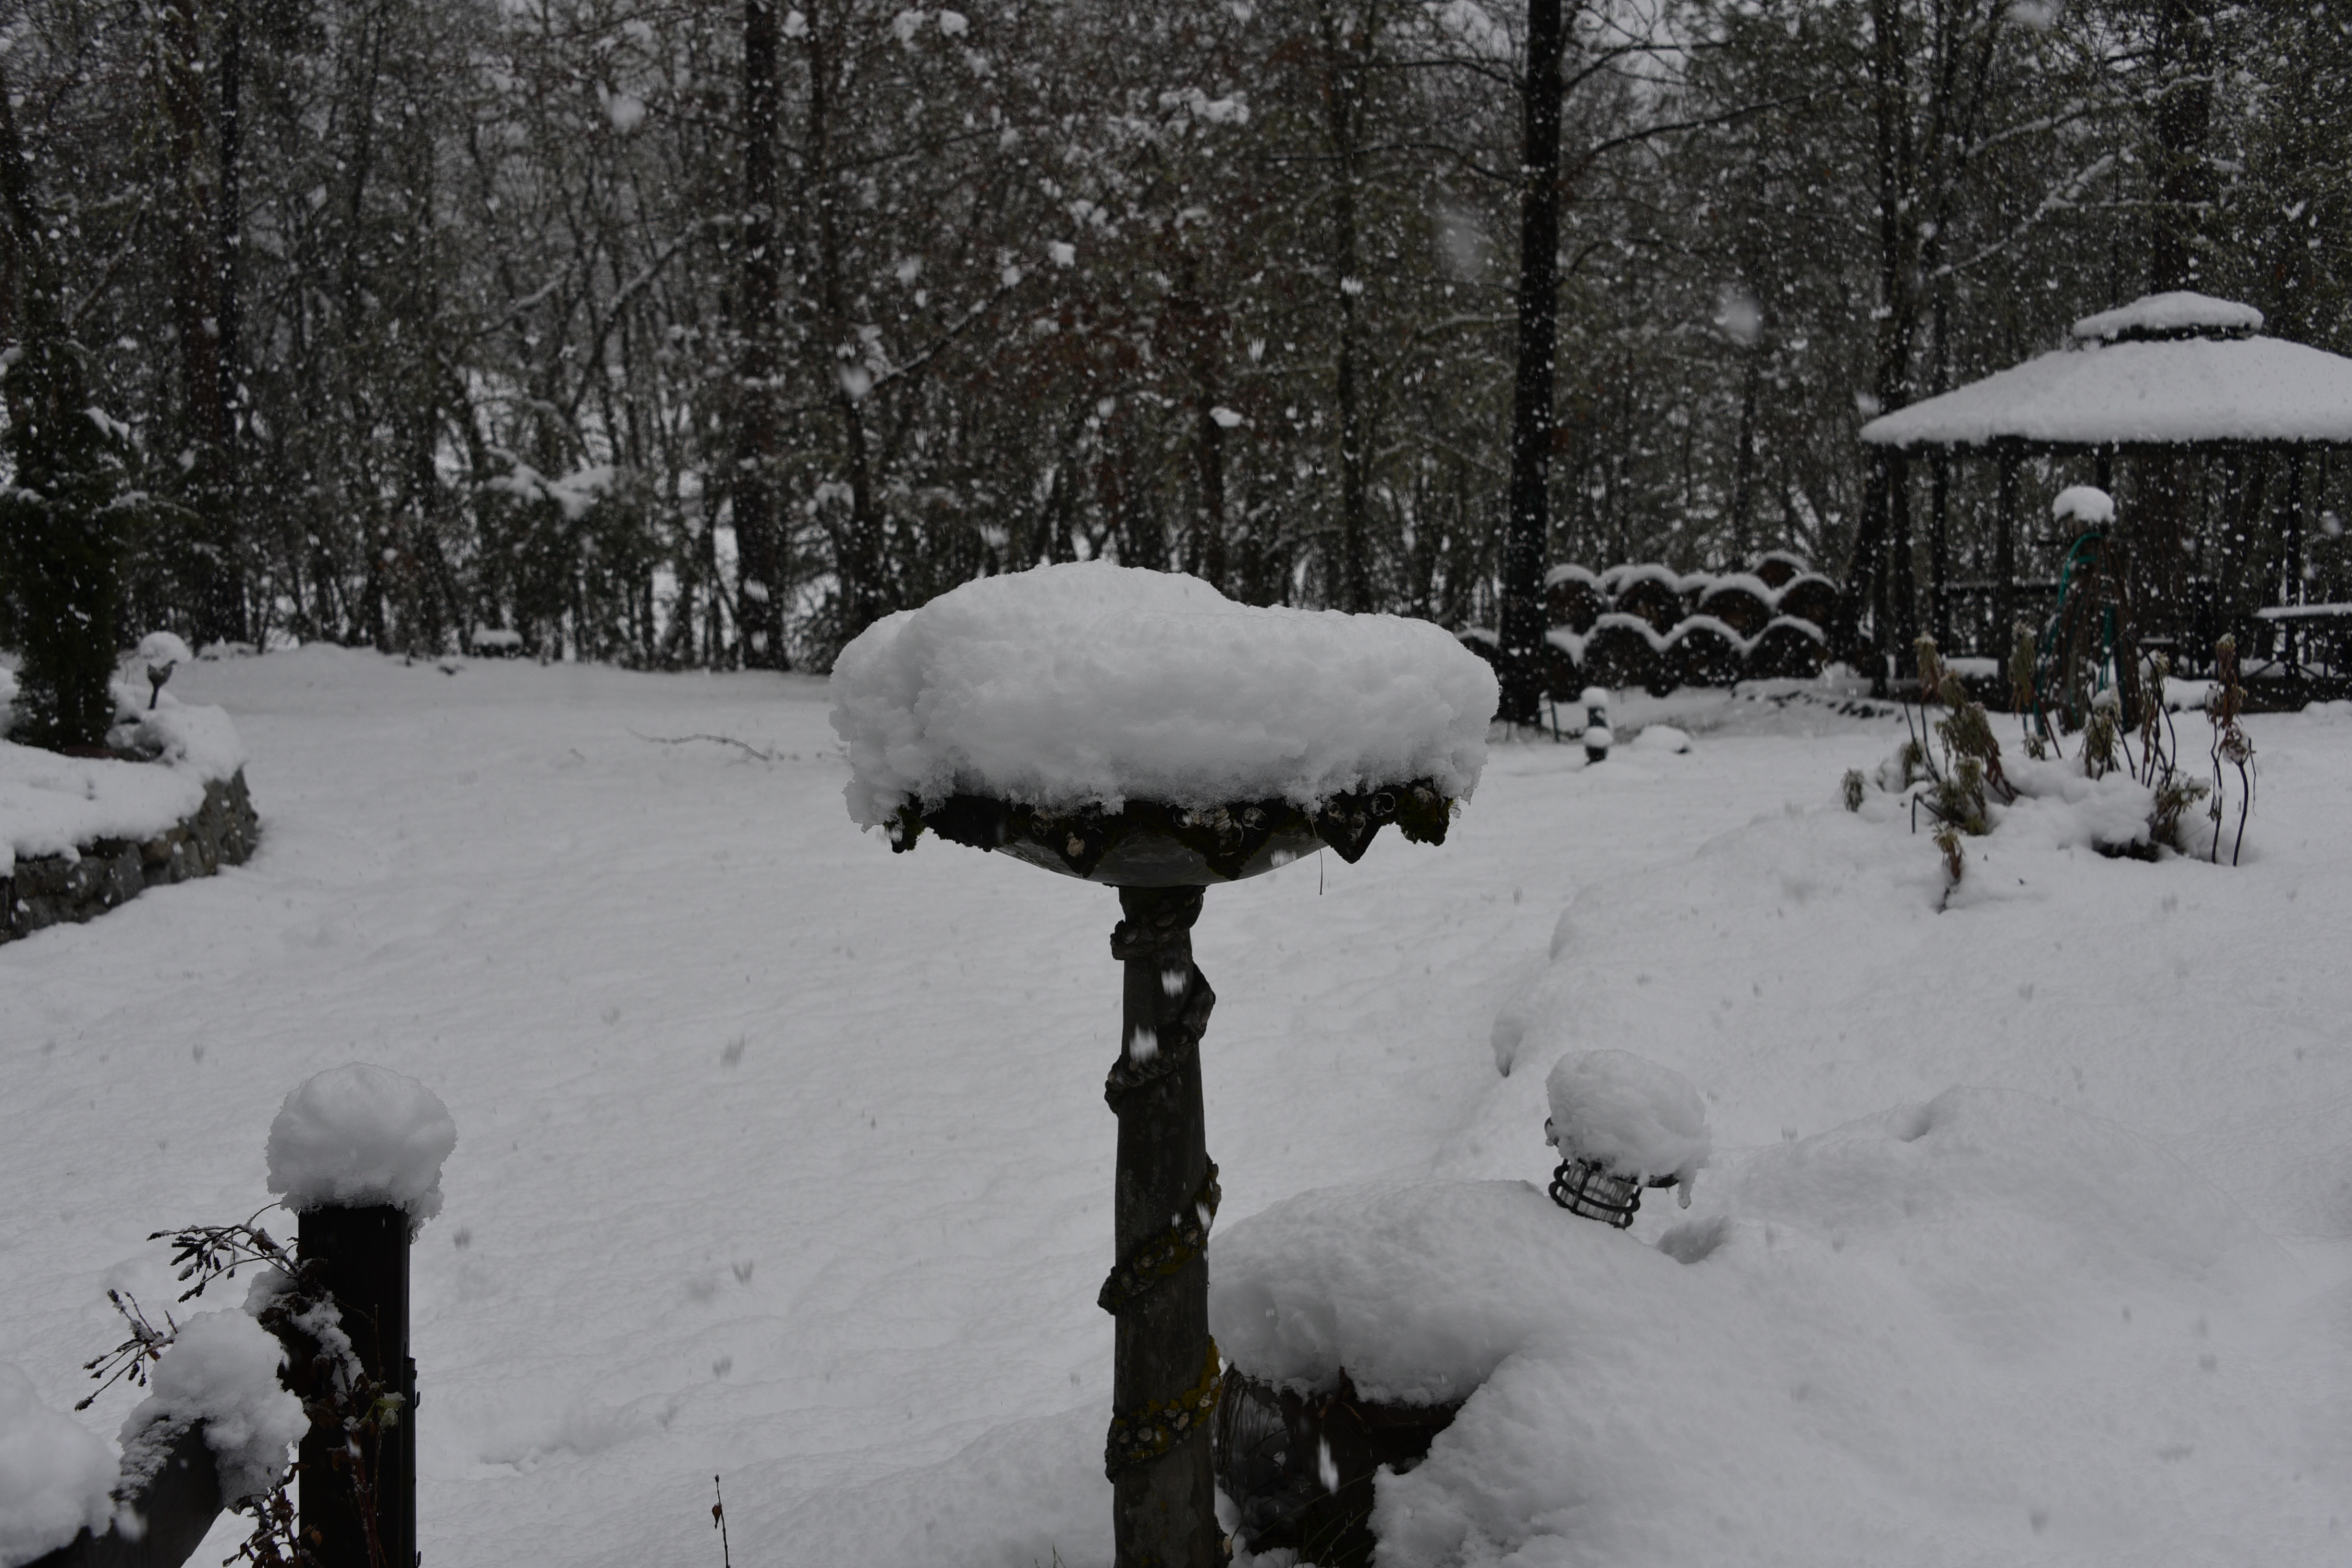
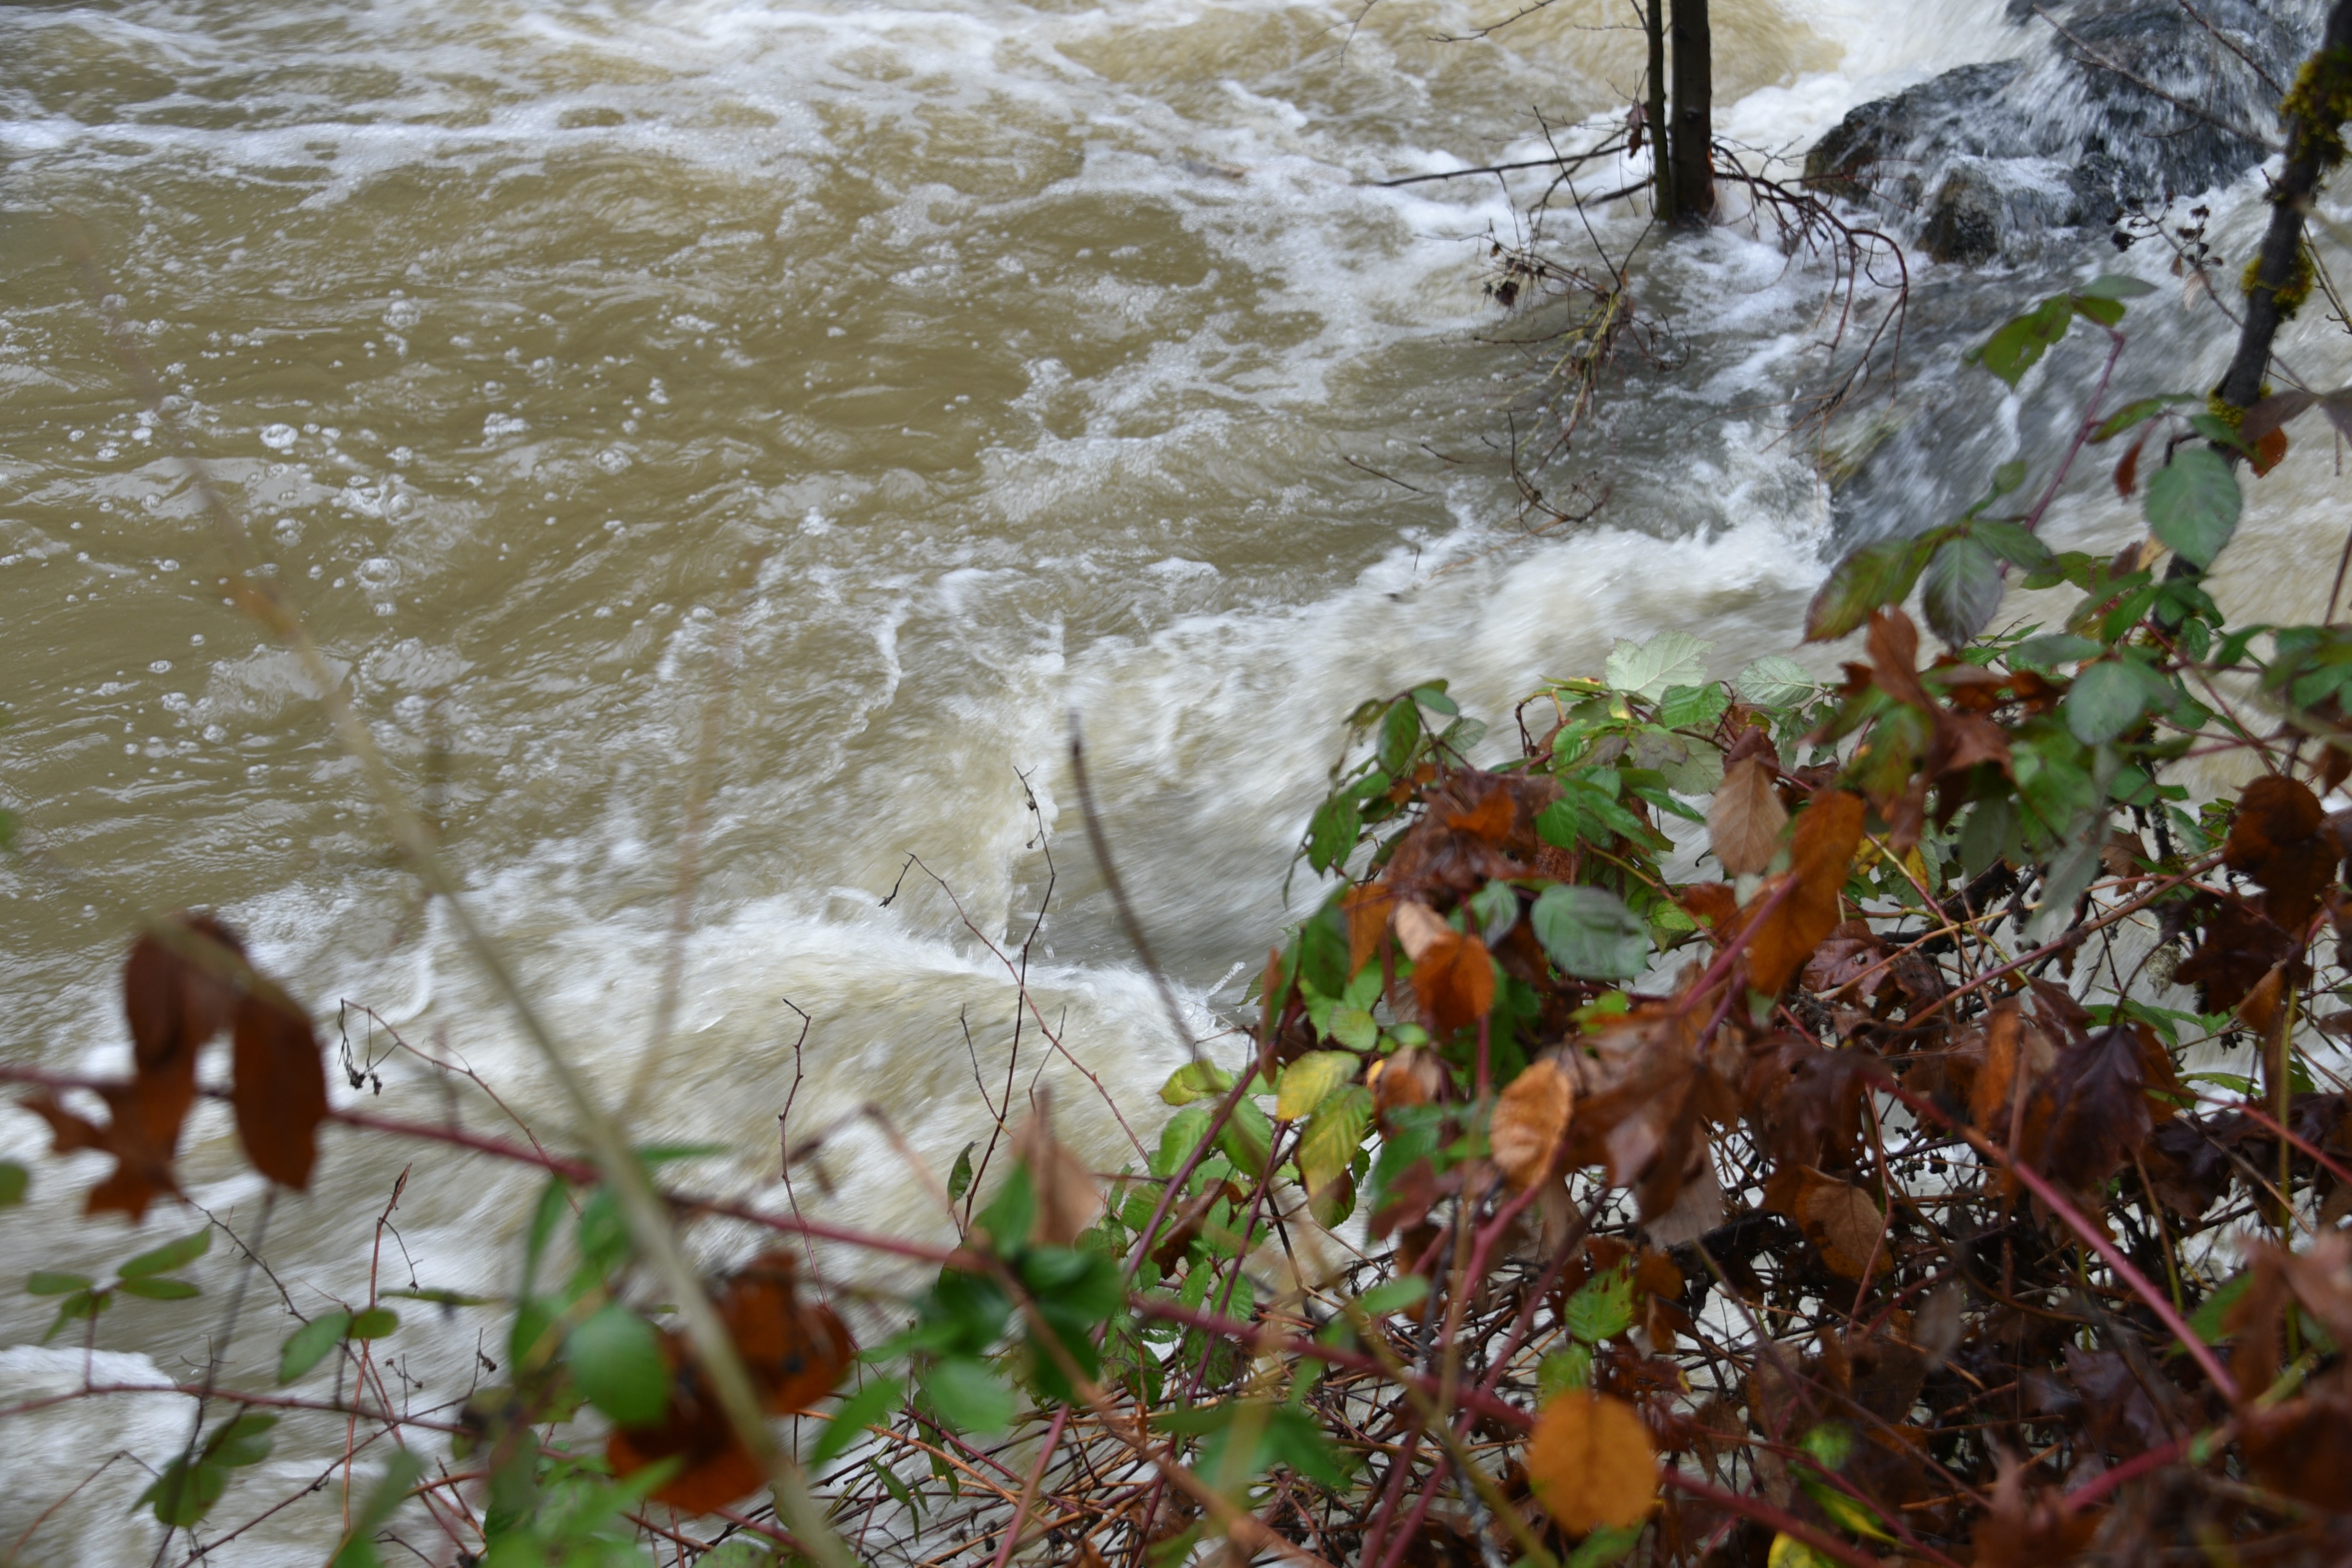
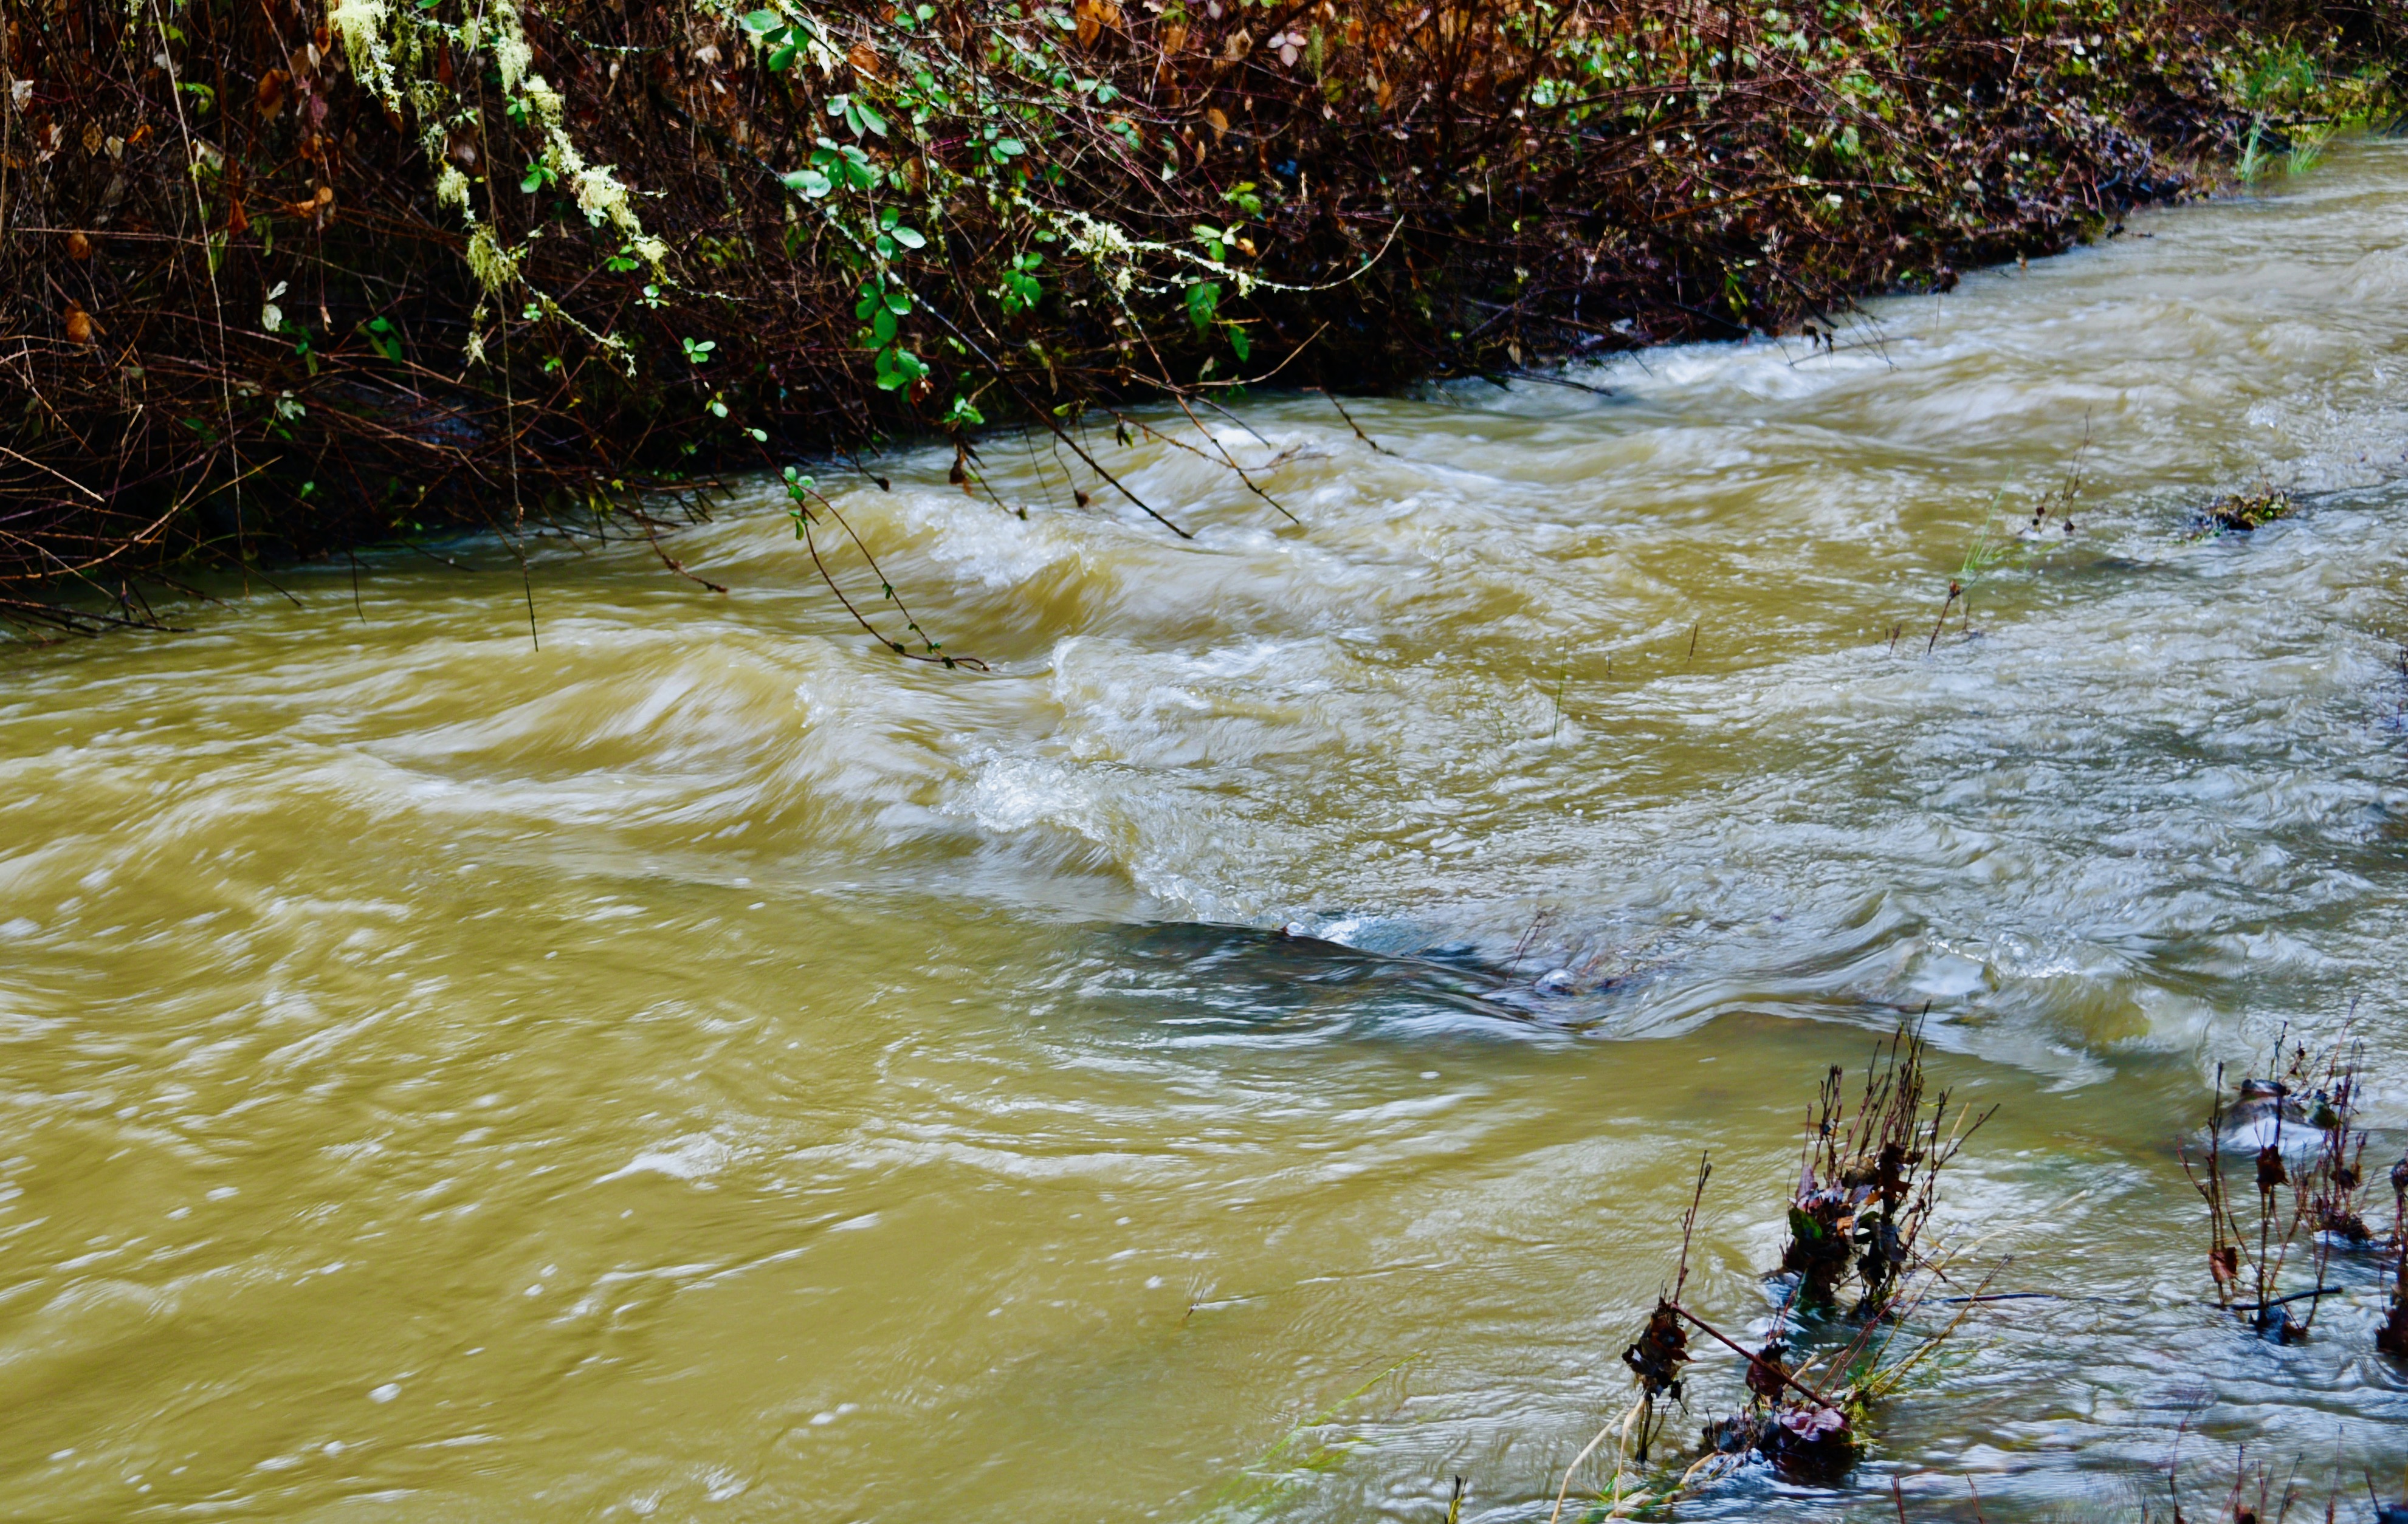
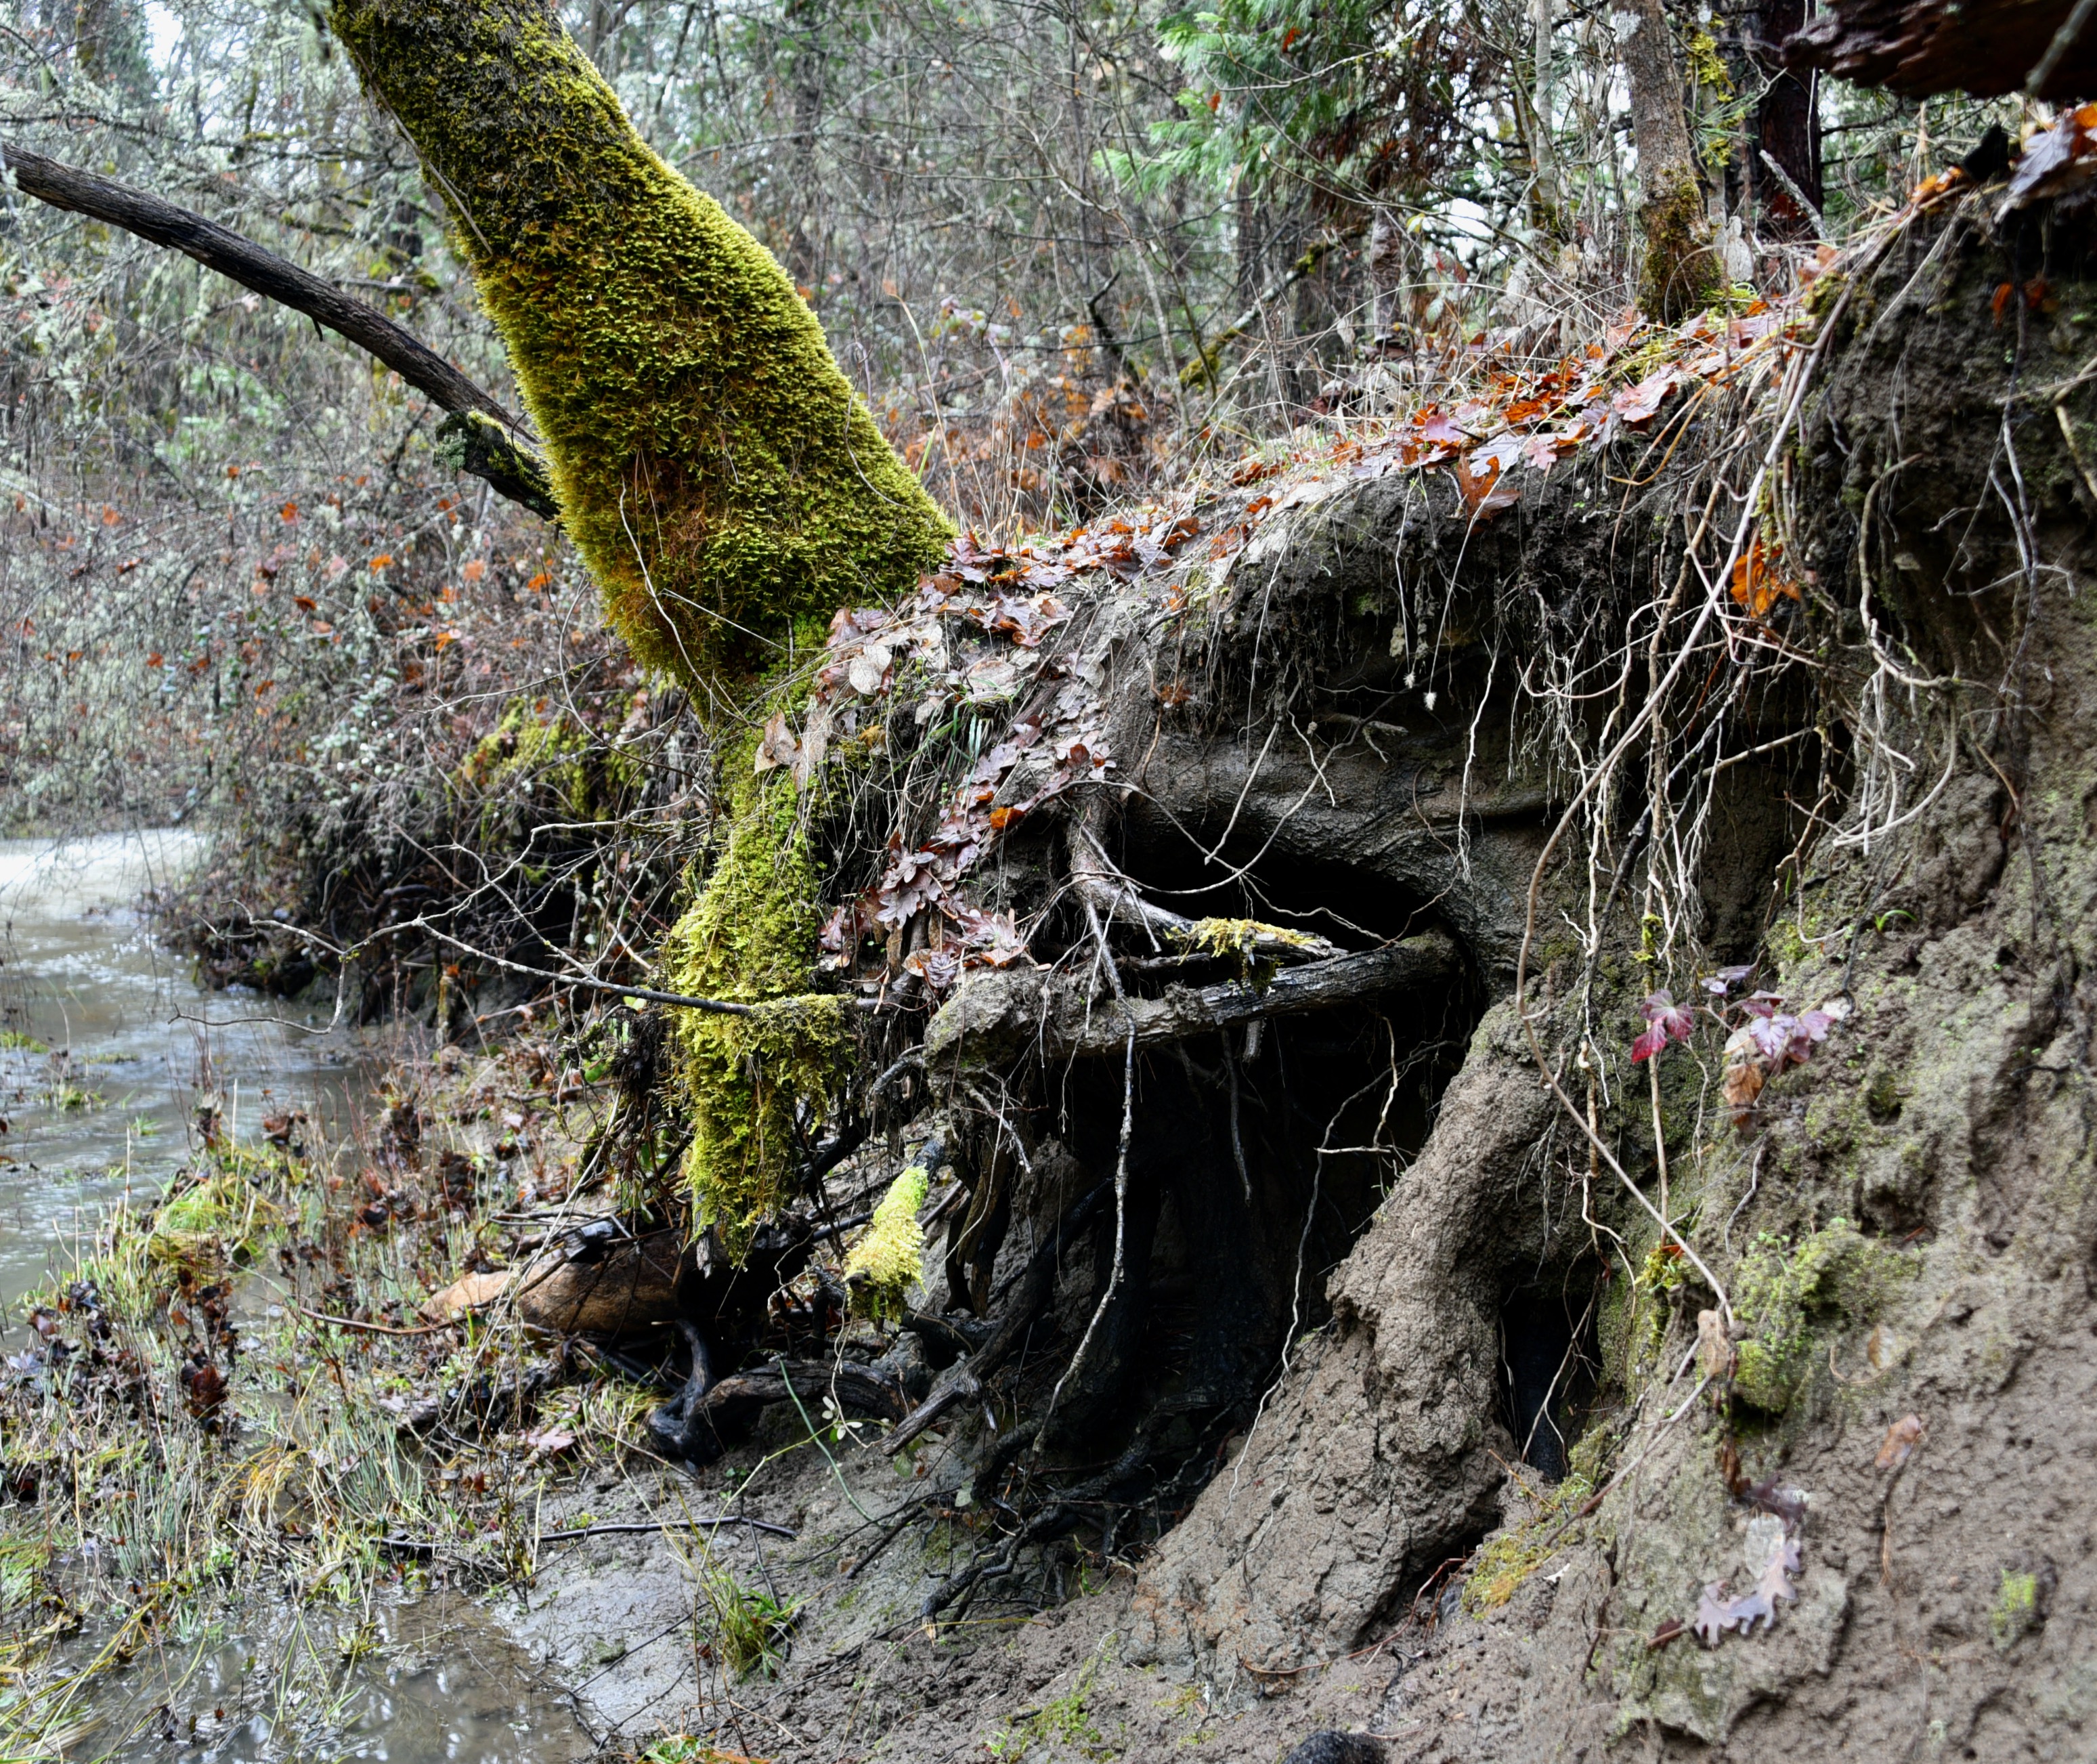
Meanwhile here in Merlin we have had loads of rain.
Bummer Creek
This is the creek that flows across the lower part of the property.
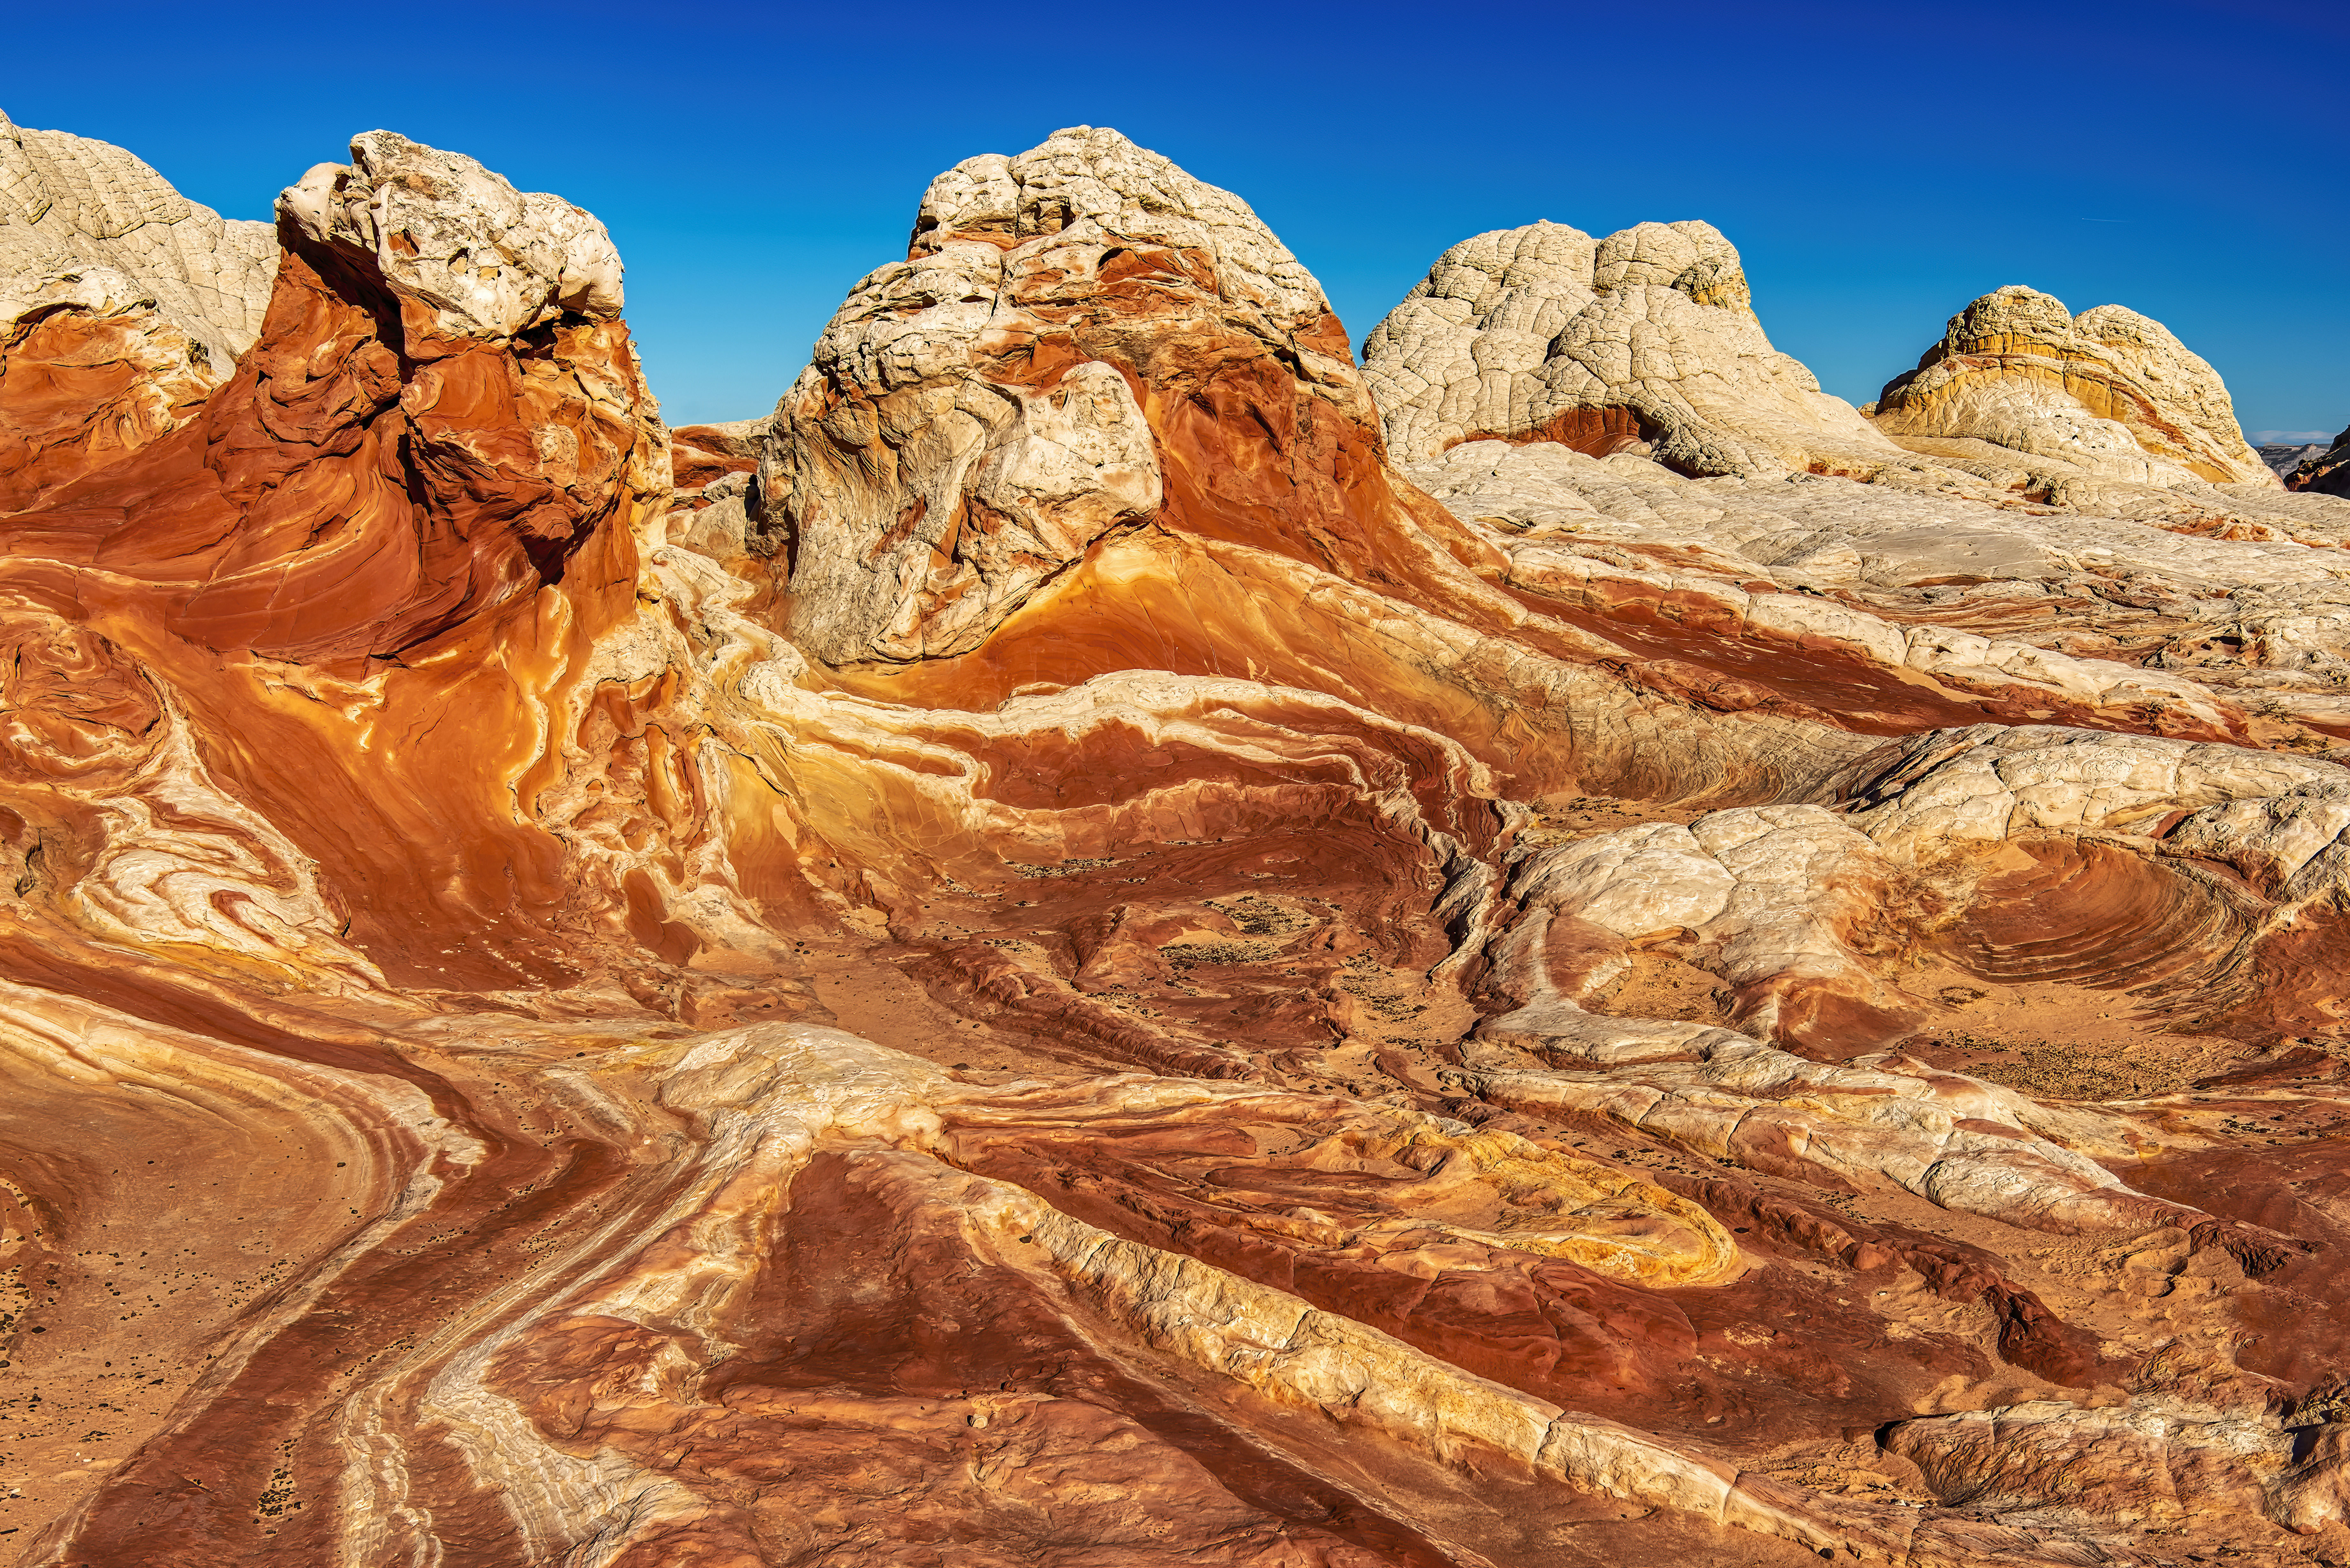
We live on a profoundly ancient and beautiful planet.
I follow the photographic website Ugly Hedgehog and have been doing for some time. There has been a post recently from the section Photo Gallery and ‘greymule’ from Colorado called his entry ‘A Couple of Desert Scenes’ and I will display just one of his images from that post.
It makes a wonderful connection to today’s post which is from The Conversation.
ooOOoo
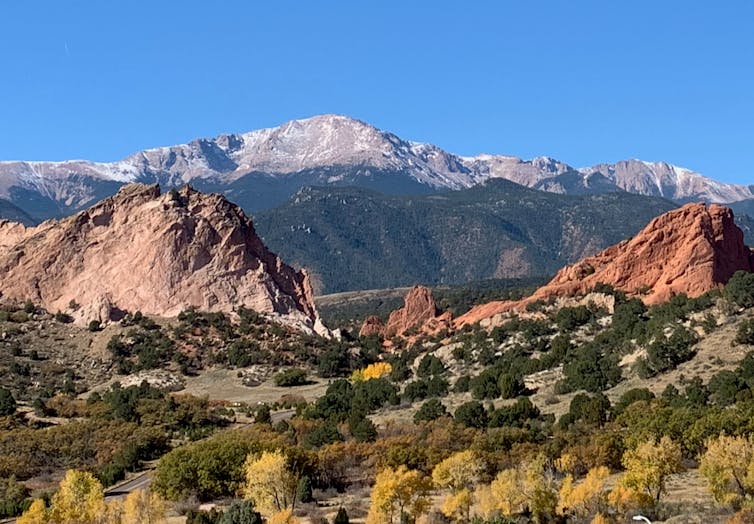
Evidence from Snowball Earth found in ancient rocks on Colorado’s Pikes Peak – it’s a missing link
Rocks can hold clues to history dating back hundreds of millions of years. Christine S. Siddoway
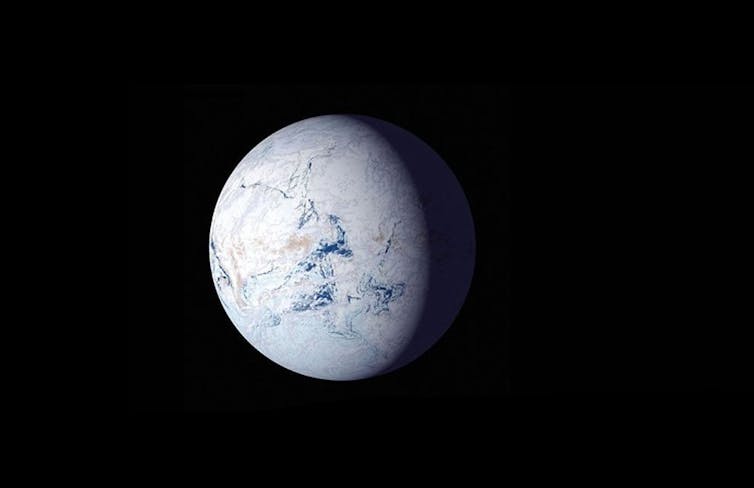
Around 700 million years ago, the Earth cooled so much that scientists believe massive ice sheets encased the entire planet like a giant snowball. This global deep freeze, known as Snowball Earth, endured for tens of millions of years.
The Snowball Earth hypothesis has been largely based on evidence from sedimentary rocks exposed in areas that once were along coastlines and shallow seas, as well as climate modeling. Physical evidence that ice sheets covered the interior of continents in warm equatorial regions had eluded scientists – until now.
In new research published in the Proceedings of the National Academy of Sciences, our team of geologists describes the missing link, found in an unusual pebbly sandstone encapsulated within the granite that forms Colorado’s Pikes Peak.
Earth iced over during the Cryogenian Period, but life on the planet survived. NASA illustration
Solving a Snowball Earth mystery on a mountain
Pikes Peak, originally named Tavá Kaa-vi by the Ute people, lends its ancestral name, Tava, to these notable rocks. They are composed of solidified sand injectites, which formed in a similar manner to a medical injection when sand-rich fluid was forced into underlying rock.
A possible explanation for what created these enigmatic sandstones is the immense pressure of an overlying Snowball Earth ice sheet forcing sediment mixed with meltwater into weakened rock below.
Dark red to purple bands of Tava sandstone dissect pink and white granite. The Tava is also cross-cut by silvery-gray veins of iron oxide. Liam Courtney-Davies
An obstacle for testing this idea, however, has been the lack of an age for the rocks to reveal when the right geological circumstances existed for sand injection.
We found a way to solve that mystery, using veins of iron found alongside the Tava injectites, near Pikes Peak and elsewhere in Colorado.
A 5-meter-tall, almost vertical Tava dike is evident in this section of Pikes Peak granite. Liam Courtney-Davies
Iron minerals contain very low amounts of naturally occurring radioactive elements, including uranium, which slowly decays to the element lead at a known rate. Recent advancements in laser-based radiometric dating allowed us to measure the ratio of uranium to lead isotopes in the iron oxide mineral hematite to reveal how long ago the individual crystals formed.
The iron veins appear to have formed both before and after the sand was injected into the Colorado bedrock: We found veins of hematite and quartz that both cut through Tava dikes and were crosscut by Tava dikes. That allowed us to figure out an age bracket for the sand injectites, which must have formed between 690 million and 660 million years ago.
So, what happened?
The time frame means these sandstones formed during the Cryogenian Period, from 720 million to 635 million years ago. The name is derived from “cold birth” in ancient Greek and is synonymous with climate upheaval and disruption of life on our planet – including Snowball Earth.
University of Exeter professor Timothy Lenton explains why the Earth was able to freeze over.
The Tava found on Pikes Peak would have formed close to the equator within the heart of an ancient continent named Laurentia, which gradually over time and long tectonic cycles moved into its current northerly position in North America today.
The origin of Tava rocks has been debated for over 125 years, but the new technology allowed us to conclusively link them to the Cryogenian Snowball Earth period for the first time.
The scenario we envision for how the sand injection happened looks something like this:
A giant ice sheet with areas of geothermal heating at its base produced meltwater, which mixed with quartz-rich sediment below. The weight of the ice sheet created immense pressures that forced this sandy fluid into bedrock that had already been weakened over millions of years. Similar to fracking for natural gas or oil today, the pressure cracked the rocks and pushed the sandy meltwater in, eventually creating the injectites we see today.
Clues to another geologic puzzle
Not only do the new findings further cement the global Snowball Earth hypothesis, but the presence of Tava injectites within weak, fractured rocks once overridden by ice sheets provides clues about other geologic phenomena.
Time gaps in the rock record created through erosion and referred to as unconformities can be seen today across the United States, most famously at the Grand Canyon, where in places, over a billion years of time is missing. Unconformities occur when a sustained period of erosion removes and prevents newer layers of rock from forming, leaving an unconformable contact.
Unconformity in the Grand Canyon is evident here where horizontal layers of 500-million-year-old rock sit on top of a mass of 1,800-million-year-old rocks. The unconformity, or ‘time gap,’ demonstrates that years of history are missing. Mike Norton via Wikimedia, CC BY-SA
Our results support that a Great Unconformity near Pikes Peak must have been formed prior to Cryogenian Snowball Earth. That’s at odds with hypotheses that attribute the formation of the Great Unconformity to large-scale erosion by Snowball Earth ice sheets themselves.
We hope the secrets of these elusive Cryogenian rocks in Colorado will lead to the discovery of further terrestrial records of Snowball Earth. Such findings can help develop a clearer picture of our planet during climate extremes and the processes that led to the habitable planet we live on today.
Global efforts to tackle climate change are wildly off track, says the UN, as new data shows that warming gases are accumulating faster than at any time in human existence.
Current national plans to limit carbon emissions would barely cut pollution by 2030, the UN analysis shows, leaving efforts to keep warming under 1.5C this century in tatters.
The update comes as a separate report shows that greenhouse gases have risen by over 11% in the last two decades, with atmospheric concentrations surging in 2023.
ooOOoo
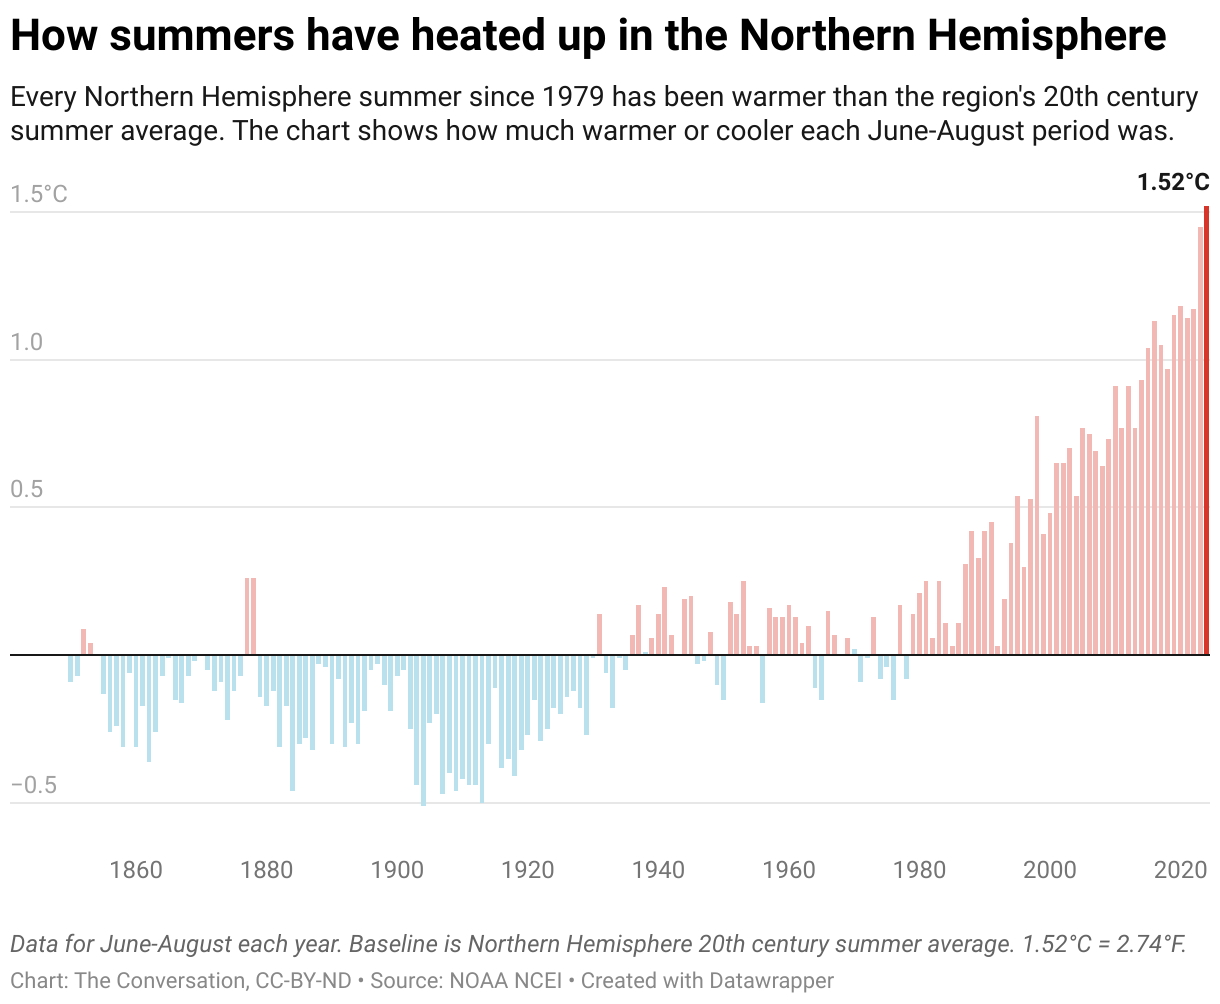
What the jet stream and climate change had to do with the hottest summer on record − remember all those heat domes?
Summer 2024 was officially the Northern Hemisphere’s hottest on record. In the United States, fierce heat waves seemed to hit somewhere almost every day.
That might seem small, but temperature increases associated with human-induced climate change do not manifest as small, even increases everywhere on the planet. Rather, they result in more frequent and severe episodes of heat waves, as the world saw in 2024.
The most severe and persistent heat waves are often associated with an atmospheric pattern called a heat dome. As an atmospheric scientist, I study weather patterns and the changing climate. Here’s how heat domes, the jet stream and climate change influence summer heat waves and the record-hot summer of 2024.
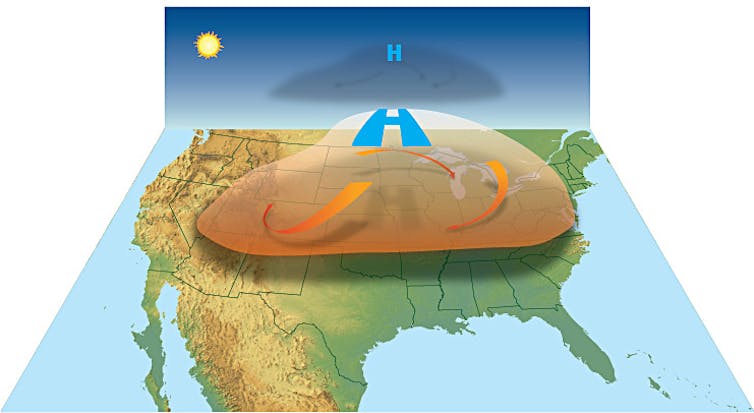
A heat dome is a persistent high-pressure system over a large area. A high-pressure system is created by sinking air. As air sinks, it warms up, decreasing relative humidity and leaving sunny weather. The high pressure also serves as a lid that keeps hot air on the surface from rising and dissipating. The resulting heat dome can persist for days or even weeks.
The longer a heat dome lingers, the more heat will build up, creating sweltering conditions for the people on the ground.
High pressure in the middle layers of the atmosphere acts as a dome or cap, allowing heat to build up at the Earth’s surface. NOAA
How long these heat domes stick around has a lot to do with the jet stream.
The jet stream is a narrow band of strong winds in the upper atmosphere, about 30,000 feet above sea level. It moves from west to east due to the Earth’s rotation. The strong winds are a result of the sharp temperature difference where the warm tropical air meets the cold polar air from the north in the mid-latitudes.
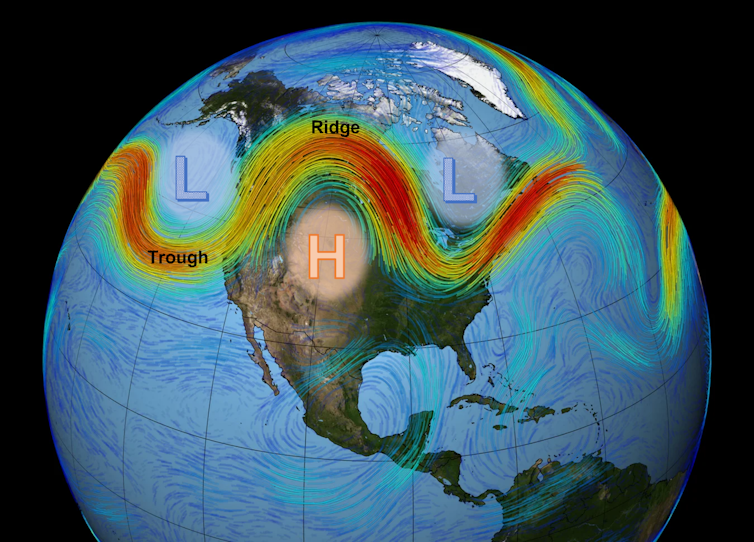
The jet stream does not flow along a straight path. Rather, it meanders to the north and south in a wavy pattern. These giant meanders are known as the Rossby waves, and they have a major influence on weather.
Where the jet stream arcs northward, forming a ridge, it creates a high-pressure system south of the wave. Where the jet stream dips southward, forming a trough, it creates a low-pressure system north of the jet stream. A low-pressure system contains rising air in the center, which cools and tends to generate precipitation and storms.
Most of our weather is modulated by the position and characteristics of the jet stream.
How climate change affects the jet stream
The jet stream, or any wind, is the result of differences in surface temperature.
In simple terms, warm air rises, creating low pressure, and cold air sinks, creating high pressure. Wind is the movement of the air from high to low pressure. Greater differences in temperature produce stronger winds.
For the Earth as a whole, warm air rises near the equator, and cold air sinks near the poles. The temperature difference between the equator and the pole determines the strength of the jet stream in each hemisphere.
However, that temperature difference has been changing, particularly in the Northern Hemisphere. The Arctic region has been warming about three times faster than the global average. This phenomenon, known as Arctic amplification, is largely caused by the melting of Arctic sea ice, which allows the exposed dark water to absorb more of the Sun’s radiation and heat up faster.
Because the Arctic is warming faster than the tropics, the temperature difference between the two regions is lessened. And that slows the jet stream.
As the jet stream slows, it tends to meander more, causing bigger waves. The bigger waves create larger high-pressure systems. These can often be blocked by the deep low-pressure systems on both sides, causing the high-pressure system to sit over a large area for a long period of time.
A stagnant polar jet stream can trapped heat over parts of North America, Europe and Asia at the same time. This example happened in July 2023. UK Met Office
Typically, waves in the jet stream pass through the continental United States in around three to five days. When blocking occurs, however, the high-pressure system could stagnate for days to weeks. This allows the heat to build up underneath, leading to blistering heat waves.
Since the jet stream circles around the globe, stagnating waves could occur in multiple places, leading to simultaneous heat waves at the mid-latitude around the world. That happened in 2024, with long-lasting heat waves in Europe, North America, Central Asia and China.
Jet stream behavior affects winter, too
The same meandering behavior of the jet stream also plays a role in extreme winter weather. That includes the southward intrusion of frigid polar air from the polar vortex and conditions for severe winter storms.
Many of these atmospheric changes, driven by human-caused global warming, have significant impacts on people’s health, property and ecosystems around the world.
I maybe approaching my own end of life but millions of others are younger than me. When I see a woman with a young baby in her arms I cannot stop myself from wondering what that generation is going to do.


