How black holes challenge our technological world.
I had no idea until reading this recent article that distant black holes are essential for measuring accurately where we are. Have a read.
ooOOoo
Scientists look to black holes to know exactly where we are in the Universe. But phones and wifi are blocking the view
Lucia McCallum, University of Tasmania
The scientists who precisely measure the position of Earth are in a bit of trouble. Their measurements are essential for the satellites we use for navigation, communication and Earth observation every day.
But you might be surprised to learn that making these measurements – using the science of geodesy – depends on tracking the locations of black holes in distant galaxies.
The problem is, the scientists need to use specific frequency lanes on the radio spectrum highway to track those black holes.
And with the rise of wifi, mobile phones and satellite internet, travel on that highway is starting to look like a traffic jam.
Why we need black holes
Satellites and the services they provide have become essential for modern life. From precision navigation in our pockets to measuring climate change, running global supply chains and making power grids and online banking possible, our civilisation cannot function without its orbiting companions.
To use satellites, we need to know exactly where they are at any given time. Precise satellite positioning relies on the so-called “global geodesy supply chain”.
This supply chain starts by establishing a reliable reference frame as a basis for all other measurements. Because satellites are constantly moving around Earth, Earth is constantly moving around the Sun, and the Sun is constantly moving through the galaxy, this reference frame needs to be carefully calibrated via some relatively fixed external objects.
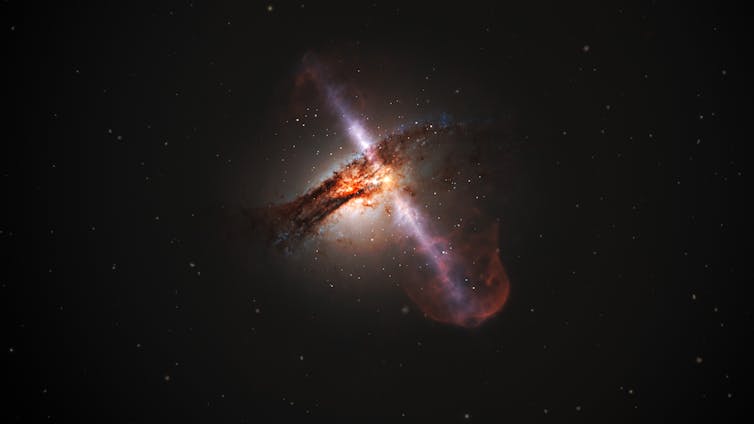
As it turns out, the best anchor points for the system are the black holes at the hearts of distant galaxies, which spew out streams of radiation as they devour stars and gas.
These black holes are the most distant and stable objects we know. Using a technique called very long baseline interferometry, we can use a network of radio telescopes to lock onto the black hole signals and disentangle Earth’s own rotation and wobble in space from the satellites’ movement.
Different lanes on the radio highway
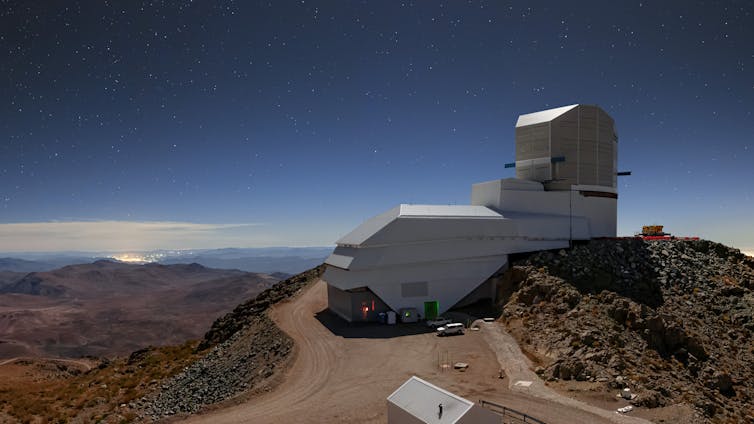
We use radio telescopes because we want to detect the radio waves coming from the black holes. Radio waves pass cleanly through the atmosphere and we can receive them during day and night and in all weather conditions.
Radio waves are also used for communication on Earth – including things such as wifi and mobile phones. The use of different radio frequencies – different lanes on the radio highway – is closely regulated, and a few narrow lanes are reserved for radio astronomy.
However, in previous decades the radio highway had relatively little traffic. Scientists commonly strayed from the radio astronomy lanes to receive the black hole signals.
To reach the very high precision needed for modern technology, geodesy today relies on more than just the lanes exclusively reserved for astronomy.
Radio traffic on the rise
In recent years, human-made electromagnetic pollution has vastly increased. When wifi and mobile phone services emerged, scientists reacted by moving to higher frequencies.
However, they are running out of lanes. Six generations of mobile phone services (each occupying a new lane) are crowding the spectrum, not to mention internet connections directly sent by a fleet of thousands of satellites.
Today, the multitude of signals are often too strong for geodetic observatories to see through them to the very weak signals emitted by black holes. This puts many satellite services at risk.
What can be done?
To keep working into the future – to maintain the services on which we all depend – geodesy needs some more lanes on the radio highway. When the spectrum is divided up via international treaties at world radio conferences, geodesists need a seat at the table.
Other potential fixes might include radio quiet zones around our essential radio telescopes. Work is also underway with satellite providers to avoid pointing radio emissions directly at radio telescopes.
Any solution has to be global. For our geodetic measurements, we link radio telescopes together from all over the world, allowing us to mimic a telescope the size of Earth. The radio spectrum is primarily regulated by each nation individually, making this a huge challenge.
But perhaps the first step is increasing awareness. If we want satellite navigation to work, our supermarkets to be stocked and our online money transfers arriving safely, we need to make sure we have a clear view of those black holes in distant galaxies – and that means clearing up the radio highway.
Lucia McCallum, Senior Scientist in Geodesy, University of Tasmania
This article is republished from The Conversation under a Creative Commons license. Read the original article.
ooOOoo
The last paragraph of Lucia’s article is key, in my opinion. Hopefully me posting this article will assist in the task of increasing awareness,


.jpg)