Category: Water

Looking after our dogs in Winter

Erik Oltad has some great advice.

In our case our (remaining) dogs, Oliver and Cleopatra, are able to go outside but still remain on our land. But plenty of dog owners are not in such a privileged position and need to take their dogs on public pavements and the like.

Thus for all you dog owners in that position then Erik’s advice is for you.

ooOOoo

Dog care below freezing − how to keep your pet warm and safe from cold weather, road salt and more this winter

Dogs get cold in the winter too, but there are things pet owners can do to help them feel comfortable. AP Photo/David Duprey

Erik Christian Olstad, University of California, Davis

Time outside with your dog in the spring, summer and fall can be lovely. Visiting your favorite downtown café on a cool spring morning, going to a favorite dog park on a clear summer evening or going on walks along a river when the leaves are changing color are all wonderful when the weather is favorable. But in much of the country, when winter rolls around, previously hospitable conditions can quickly turn chilly and dangerous for people and pups alike.

Winter brings some unique challenges for dog owners, since dogs still need activity and socialization during colder seasons. Studies have shown that dog owners are almost 50% less likely to walk their dogs when the weather gets cold. Knowing the basics of winter safety is critical to maintaining a healthy lifestyle for your dog.

I am an assistant professor at the University of California Davis School of Veterinary Medicine who weathered polar vortexes with my dog while living in Michigan early in my career. While I’ve since moved to sunny California, I’ve seen how quickly frigid temperatures can turn dangerous for pets.

Breed and age differences

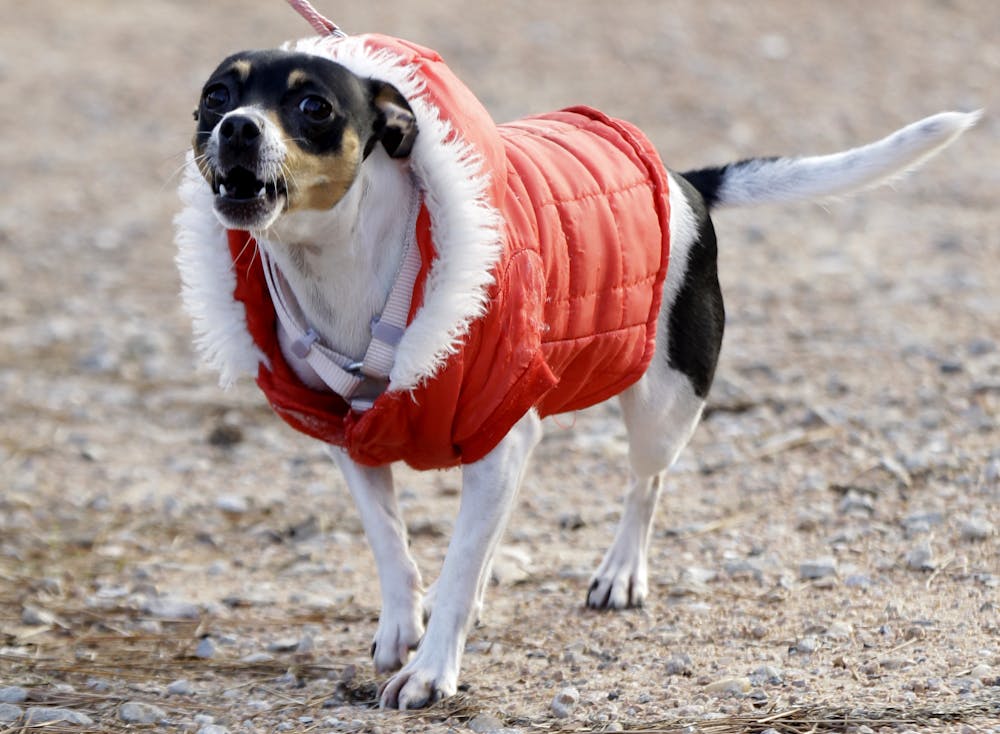
Not all dogs have the same abilities to deal with cold weather. A short-coated dog like a Chihuahua is much more susceptible to the dangers of cold weather than a thick-coated husky. When the weather dips below 40 degrees Fahrenheit (4 degrees Celsius), the well-acclimated husky may be comfortable, whereas the Chihuahua would shiver and be at risk of hypothermia.

Additionally, if your dog is used to warm weather, but you decide to move to a colder region, the dog will need time to acclimate to that colder weather, even if they have a thick coat.

Age also affects cold-weather resilience. Puppies and elderly dogs can’t withstand the chill as well as other dogs, but every dog is unique – each may have individual health conditions or physical attributes that make them more or less resilient to cold weather.

When is my dog too cold?

A small dog wearing a thick, fluffy red coat.
Dog jackets can keep pets warm in the cold. AP Photo/David J. Phillip

Pet owners should be able to recognize the symptoms of a dog that is getting too cold. Dogs will shiver, and some may vocalize or whine. Dogs may resist putting their feet down on the cold ground, or burrow, or try to find warmth in their environment when they are uncomfortable.

Just like people, dogs can get frostbite. And just like people, the signs can take days to appear, making it hard to assess them in the moment. The most common sites for frostbite in dogs are their ears and the tips of their tails. Some of the initial signs of frostbite are skin discoloring, turning paler than normal, or purple, gray or even black; red, blistered skin; swelling; pain at the site; or ulceration.

Other serious signs of hypothermia include sluggishness or lethargy, and if you observe them, please visit your veterinarian immediately. A good rule to live by is if it is too cold for you, it is too cold for your dog.

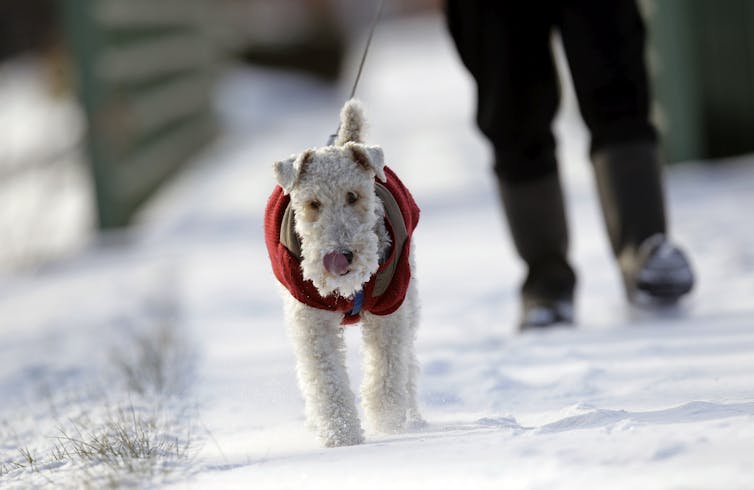
Getting your dog a sweater or jacket and paw covers can provide them with protection from the elements and keep them comfortable. Veterinarians also recommend closely monitoring your dog and limiting their time outside when the temperature nears the freezing point or drops below it.
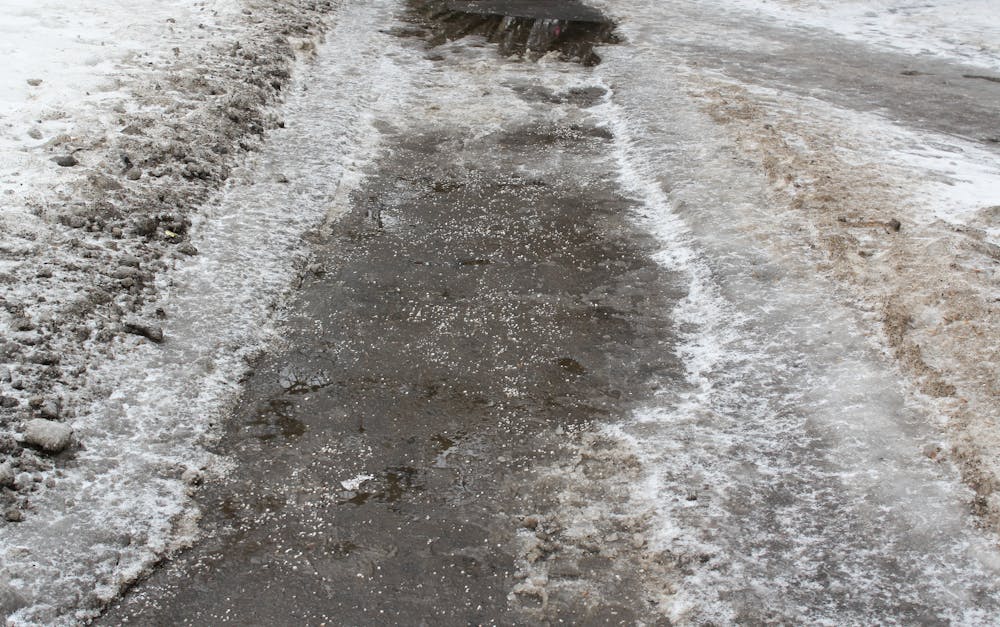
Road salt dangers

Road salt that treats ice on streets and sidewalks can also harm dogs. When dogs walk on the salt, the sharp, rough edges of the salt crystals can irritate the sensitive skin on their paws.

A fluffy dog sits in the snow wearing two cloth, polka dot paw covers.
Paw covers for dogs can keep their feet warm and protected from road salt. AP Photo/Jim Cole

Dogs will often lick their feet when they’re dirty, wet or irritated, and if they ingest any salt doing that, they may face GI upset, dehydration, kidney failure, seizures or even death. Even small amounts of pure salt can disrupt critical body functions in dogs.

Some companies make pet-safe salt, but in public it can be hard to tell what type of salt is on the ground. After walking your dog, wash off their feet or boots. You can also keep their paw fur trimmed to prevent snow from balling up or salt collecting in the fur. Applying a thin layer of petroleum jelly or paw pad balm to the skin of the paw pads can also help protect your pet’s paws from irritation.

A snowy sidewalk covered in tiny chunks of salt.
Road salt can be harmful to dogs’ sensitive paws. Stolbovsky/Wikimedia Commons, CC BY-SA

Antifreeze risks

Antifreeze, or ethylene glycol, is in most vehicles to prevent the fluids from freezing when it gets cold out. Some people pour antifreeze into their toilets when away from their home to prevent the water in the toilet from freezing.

Antifreeze is an exceptionally dangerous chemical to dogs and cats, as it tastes sweet but can be deadly when ingested. If a pet ingests even a small amount of antifreeze, the substance causes a chemical cascade in their body that results in severe kidney damage. If left untreated, the pet may have permanent kidney damage or die.

There are safer antifreeze options on the market that use ingredients other than ethylene glycol. If your dog ingests antifreeze, please see your veterinarian immediately for treatment.

When temperatures dip below freezing, the best thing pet owners can do is keep the time spent outside as minimal as possible. Try some indoor activities, like hide-and-seek with low-calorie treats, fetch or even an interactive obstacle course. Food puzzles can also keep your dog mentally engaged during indoor time.

Although winter presents some unique challenges, it can still be an enjoyable and healthy time for you and your canine companion.

Erik Christian Olstad, Health Sciences Assistant Professor of Clinical Veterinary Medicine, University of California, Davis

This article is republished from The Conversation under a Creative Commons license. Read the original article.

ooOOoo

Erik’s comments about ethylene glycol (EG), or antifreeze as it more commonly known, and the incredible dangers to dogs EG possesses are vital to understand.

Please, please keep your dogs very safe in Winter! If Erik’s advice helps save even a single dog then me republishing this will have been worthwhile.

Hollywood movie to reality?

Where is the global climate going?

The challenge with writing posts, albeit not so often, about the global environment, especially when I am a non-scientist, is that one relies entirely on the words of others. In the case of a recent article, published by The Conversation, the authors are claimed to be specialists, and I do not doubt their credentials.

The three authors are René van Westen who is a Postdoctoral Researcher in Climate Physics, at Utrecht University, Henk A. Dijkstra who is a Professor of Physics, also at Utrecht University, and Michael Kliphuis, a Climate Model Specialist, again at Utrecht University.

So, here is their article:

ooOOoo

Atlantic Ocean is headed for a tipping point − once melting glaciers shut down the Gulf Stream, we would see extreme climate change within decades, study shows

Too much fresh water from Greenland’s ice sheet can slow the Atlantic Ocean’s circulation. Paul Souders/Stone via Getty Images

René van Westen, Utrecht University; Henk A. Dijkstra, Utrecht University, and Michael Kliphuis, Utrecht University

Superstorms, abrupt climate shifts and New York City frozen in ice. That’s how the blockbuster Hollywood movie “The Day After Tomorrow” depicted an abrupt shutdown of the Atlantic Ocean’s circulation and the catastrophic consequences.

While Hollywood’s vision was over the top, the 2004 movie raised a serious question: If global warming shuts down the Atlantic Meridional Overturning Circulation, which is crucial for carrying heat from the tropics to the northern latitudes, how abrupt and severe would the climate changes be?

Twenty years after the movie’s release, we know a lot more about the Atlantic Ocean’s circulation. Instruments deployed in the ocean starting in 2004 show that the Atlantic Ocean circulation has observably slowed over the past two decades, possibly to its weakest state in almost a millennium. Studies also suggest that the circulation has reached a dangerous tipping point in the past that sent it into a precipitous, unstoppable decline, and that it could hit that tipping point again as the planet warms and glaciers and ice sheets melt.

In a new study using the latest generation of Earth’s climate models, we simulated the flow of fresh water until the ocean circulation reached that tipping point.

The results showed that the circulation could fully shut down within a century of hitting the tipping point, and that it’s headed in that direction. If that happened, average temperatures would drop by several degrees in North America, parts of Asia and Europe, and people would see severe and cascading consequences around the world.

We also discovered a physics-based early warning signal that can alert the world when the Atlantic Ocean circulation is nearing its tipping point.

The ocean’s conveyor belt

Ocean currents are driven by winds, tides and water density differences.

In the Atlantic Ocean circulation, the relatively warm and salty surface water near the equator flows toward Greenland. During its journey it crosses the Caribbean Sea, loops up into the Gulf of Mexico, and then flows along the U.S. East Coast before crossing the Atlantic.

Two illustrations show how the AMOC looks today and its weaker state in the future
How the Atlantic Ocean circulation changes as it slows. IPCC 6th Assessment Report

This current, also known as the Gulf Stream, brings heat to Europe. As it flows northward and cools, the water mass becomes heavier. By the time it reaches Greenland, it starts to sink and flow southward. The sinking of water near Greenland pulls water from elsewhere in the Atlantic Ocean and the cycle repeats, like a conveyor belt.

Too much fresh water from melting glaciers and the Greenland ice sheet can dilute the saltiness of the water, preventing it from sinking, and weaken this ocean conveyor belt. A weaker conveyor belt transports less heat northward and also enables less heavy water to reach Greenland, which further weakens the conveyor belt’s strength. Once it reaches the tipping point, it shuts down quickly.

What happens to the climate at the tipping point?

The existence of a tipping point was first noticed in an overly simplified model of the Atlantic Ocean circulation in the early 1960s. Today’s more detailed climate models indicate a continued slowing of the conveyor belt’s strength under climate change. However, an abrupt shutdown of the Atlantic Ocean circulation appeared to be absent in these climate models. https://www.youtube.com/embed/p4pWafuvdrY?wmode=transparent&start=0 How the ocean conveyor belt works.

This is where our study comes in. We performed an experiment with a detailed climate model to find the tipping point for an abrupt shutdown by slowly increasing the input of fresh water.

We found that once it reaches the tipping point, the conveyor belt shuts down within 100 years. The heat transport toward the north is strongly reduced, leading to abrupt climate shifts.

The result: Dangerous cold in the North

Regions that are influenced by the Gulf Stream receive substantially less heat when the circulation stops. This cools the North American and European continents by a few degrees.

The European climate is much more influenced by the Gulf Stream than other regions. In our experiment, that meant parts of the continent changed at more than 5 degrees Fahrenheit (3 degrees Celsius) per decade – far faster than today’s global warming of about 0.36 F (0.2 C) per decade. We found that parts of Norway would experience temperature drops of more than 36 F (20 C). On the other hand, regions in the Southern Hemisphere would warm by a few degrees.

Two maps show US and Europe both cooling by several degrees if the AMOC stops.
The annual mean temperature changes after the conveyor belt stops reflect an extreme temperature drop in northern Europe in particular. René M. van Westen

These temperature changes develop over about 100 years. That might seem like a long time, but on typical climate time scales, it is abrupt.

The conveyor belt shutting down would also affect sea level and precipitation patterns, which can push other ecosystems closer to their tipping points. For example, the Amazon rainforest is vulnerable to declining precipitation. If its forest ecosystem turned to grassland, the transition would release carbon to the atmosphere and result in the loss of a valuable carbon sink, further accelerating climate change.

The Atlantic circulation has slowed significantly in the distant past. During glacial periods when ice sheets that covered large parts of the planet were melting, the influx of fresh water slowed the Atlantic circulation, triggering huge climate fluctuations.

So, when will we see this tipping point?

The big question – when will the Atlantic circulation reach a tipping point – remains unanswered. Observations don’t go back far enough to provide a clear result. While a recent study suggested that the conveyor belt is rapidly approaching its tipping point, possibly within a few years, these statistical analyses made several assumptions that give rise to uncertainty.

Instead, we were able to develop a physics-based and observable early warning signal involving the salinity transport at the southern boundary of the Atlantic Ocean. Once a threshold is reached, the tipping point is likely to follow in one to four decades.

A line chart of circulation strength shows a quick drop-off after the amount of freshwater in the ocean hits a tipping point.
A climate model experiment shows how quickly the AMOC slows once it reaches a tipping point with a threshold of fresh water entering the ocean. How soon that will happen remains an open question. René M. van Westen

The climate impacts from our study underline the severity of such an abrupt conveyor belt collapse. The temperature, sea level and precipitation changes will severely affect society, and the climate shifts are unstoppable on human time scales.

It might seem counterintuitive to worry about extreme cold as the planet warms, but if the main Atlantic Ocean circulation shuts down from too much meltwater pouring in, that’s the risk ahead.

This article was updated to Feb. 11, 2024, to fix a typo: The experiment found temperatures in parts of Europe changed by more than 5 F per decade.

René van Westen, Postdoctoral Researcher in Climate Physics, Utrecht University; Henk A. Dijkstra, Professor of Physics, Utrecht University, and Michael Kliphuis, Climate Model Specialist, Utrecht University

This article is republished from The Conversation under a Creative Commons license. Read the original article.

ooOOoo

I am 79! I like to think that whatever is coming down the wires, so to speak, will be after my death. But that is a cop out for a) I have a son and a daughter who are in their early fifties, b) I have a grandson, my daughter and son-in-law’s young man, who is a teenager, with his birthday next month, and c) I could possibly live for another twenty years.

The challenge is how to bring this imminent catastrophic global change in temperature to the fore. We need a global solution now enforced by a globally respected group of scientists and leaders, and, frankly, I do not see that happening.

All one can do is to hope. Hope that the global community will eschew the present-day extremes of warring behaviour and see the need for change. That is NOW!

So that the Hollywood movie, The Day After Tomorrow, remains a fictional story. And for those that have forgotten the film or who have never seen it, here is a small slice of a Wikipedia report:

The Day After Tomorrow is a 2004 American science fiction disaster film conceived, co-writtendirected, co-produced by Roland Emmerich, based on the 1999 book The Coming Global Superstorm by Art Bell and Whitley Strieber, and starring Dennis QuaidJake GyllenhaalSela WardEmmy Rossum, and Ian Holm. The film depicts catastrophic climatic effects following the disruption of the North Atlantic Ocean circulation, in which a series of extreme weather events usher in climate change and lead to a new ice age.

Wikipedia

And here is a YouTube video:

There we go, folks!

Brandy has been found

Found drowned yesterday morning.

I went out yesterday morning to walk to the front gate; it is a quarter mile. I decided to take my Nikon with me.

Halfway between the bridge over Bummer Creek and our gate, I wondered if the tiny stream was flowing down that comes from the other side of the Hugo road. Imagine my surprise when I found a dead Brandy.

It was such a shock. I ached with pain and it was a while before I could function again.

However having the Nikon with me I was able to take a few photographs.

More on Sunday.

Atmospheric river hitting us in Merlin

The atmospheric river in California is reaching up to Southern Oregon

After we had the thick end of twelve inches of rain in January, February has kept up the downpours; as of yesterday morning we had had 0.52 inches (1.32 cm) for the month and it was still raining. (And 0.8 in at 08:00 this morning.)

Here’s an item from yesterday about the situation in California.

Plus the BBC News had an item on the California flood.

So it seemed opportune to present this article on atmospheric rivers.

ooOOoo

What is an atmospheric river? A hydrologist explains the good and bad of these flood-prone storms and how they’re changing

A satellite image shows a powerful atmospheric river hitting the Pacific Northwest in December 2023. Darker greens are more water vapor. Lauren Dauphin/NASA Earth Observatory

By Qian Cao, University of California, San Diego

A series of atmospheric rivers is bringing the threat of heavy downpours, flooding, mudslides and avalanches to the Pacific Northwest and California this week. While these storms are dreaded for the damage they can cause, they are also essential to the region’s water supply, particularly in California, as Qian Cao, a hydrologist at the University of California, San Diego, explains.

What are atmospheric rivers?

An atmospheric river is a narrow corridor or filament of concentrated water vapor transported in the atmosphere. It’s like a river in the sky that can be 1,000 miles long. On average, atmospheric rivers have about twice the regular flow of the Amazon River.

When atmospheric rivers run up against mountains or run into local atmospheric dynamics and are forced to ascend, the moisture they carry cools and condenses, so they can produce intense rainfall or snowfall. https://www.youtube.com/embed/w3rtYM0HtIM?wmode=transparent&start=0 A satellite view of atmospheric rivers.

Atmospheric rivers occur all over the world, most commonly in the mid-latitudes. They form when large-scale weather patterns align to create narrow channels, or filaments, of intense moisture transport. These start over warm water, typically tropical oceans, and are guided toward the coast by low-level jet streams ahead of cold fronts of extratropical cyclones.

Along the U.S. West Coast, the Pacific Ocean serves as the reservoir of moisture for the storm, and the mountain ranges act as barriers, which is why the western sides of the coastal ranges and Sierra Nevada see so much rain and snow.

Why are back-to-back atmospheric rivers a high flood risk?

Consecutive atmospheric rivers, known as AR families, can cause significant flooding.

The first heavy downpours saturate the ground. As consecutive storms arrive, their precipitation falls on soil that can’t absorb more water. That contributes to more runoff. Rivers and streams fill up. In the meantime, there may be snowmelt due to warm temperatures, further adding to the runoff and flood risk.

California experienced a historic run of nine consecutive atmospheric rivers in the span of three weeks in December 2022 and January 2023. The storms helped bring most reservoirs back to historical averages in 2023 after several drought years, but they also produced damaging floods and debris flows.

An animation shows filaments of water heading toward the coast.
Atmospheric rivers forming over the tropical Pacific Ocean head for the U.S. West Coast. NOAA

The cause of AR families is an active area of research. Compared with single atmospheric river events, AR families tend to be associated with lower atmospheric pressure heights across the North Pacific, higher pressure heights over the subtropics, a stronger and more zonally elongated jet stream and warmer tropical air temperatures.

Large-scale weather patterns and climate phenomena such as the Madden-Julian Oscillation, or MJO, also play an important role in the generation of AR families. An active MJO shift occurred during the early 2023 events, tilting the odds toward increased atmospheric river activity over California.

A truck drives through muddy streets that fill a large section of town. People stand on one small patch of pavement not flooded.
An aerial view shows a flooded neighborhood in the community of Pajaro in central California on March 11, 2023, after a series of atmospheric rivers. Josh Edelson/AFP via Getty Images

A recent study by scientists at Stanford and the University of Florida found that storms within AR families cause three to four times more economic damage when the storms arrive back to back than they would have caused by themselves.

How important are atmospheric rivers to the West Coast’s water supply?

I’m a research hydrologist, so I focus on hydrological impacts of atmospheric rivers. Although they can lead to flood hazards, atmospheric rivers are also essential to the Western water supply. Atmospheric rivers have been responsible for ending more than a third of the region’s major droughts, including the severe California drought of 2012-16.

Atmospheric rivers provide an average of 30% to 50% of the West Coast’s annual precipitation.

They also contribute to the snowpack, which provides a significant portion of California’s year-round water supply.

In an average year, one to two extreme atmospheric rivers with snow will be the dominant contributors to the snowpack in the Sierra Nevada. Together, atmospheric rivers will contribute about 30% to 40% of an average season’s total snow accumulation there.

A dam spillway with a full reservoir behind it.
After several winter storms brought record snowfall to California’s Sierra Nevada in early 2023, Lake Oroville, California’s second-largest reservoir, was at 100% capacity. The previous year, much of the state had faced water restrictions. Justin Sullivan/Getty Images

That’s why my colleagues at the Center for Western Weather and Water Extremes at the Scripps Institution of Oceanography, part of the University of California, San Diego, work on improving atmospheric river forecasts and predictions. Water managers need to be able to regulate reservoirs and figure out how much water they can save for the dry season while still leaving room in the reservoirs to manage flood risk from future storms.

How is global warming affecting atmospheric rivers?

As global temperatures rise in the future, we can expect more intense atmospheric rivers, leading to an increase in heavy and extreme precipitation events.

My research also shows that more atmospheric rivers are likely to occur concurrently during already wet conditions. So, the chance of extreme flooding also increases. Another study, by scientists from the University of Washington, suggests that there will be a seasonal shift to more atmospheric rivers earlier in the rainy season.

There will likely also be more year-to-year variability in the total annual precipitation, particularly in California, as a study by my colleagues at the Center for Western Weather and Water Extremes projects.

Qian Cao, Hydrologist, Center For Western Weather and Water Extremes, University of California, San Diego

This article is republished from The Conversation under a Creative Commons license. Read the original article.

ooOOoo

PBS have also presented an item on what is an atmospheric river. Their article starts:

Forecasters warned of dangerous flooding, heavy mountain snow and a heightened risk of mudslides and avalanches Feb. 4-6, 2024, as a powerful atmospheric river took aim at California. It’s the latest in a series of atmospheric rivers to bring extreme rainfall to the West Coast.

Qian Cao

I sense many things are changing and the challenge is not to let one’s imagination go into overdrive.

Dogs are the best!

This came in from our neighbour, Dordie!

You will love it!

ooOOoo

This dog catching a fish while his owner is away.. Dogs are the best..

It was originally posted on ‘X’ by but then I found it on YouTube. However the text that was shown on X read:

Buitengebieden,

Welcome to the positive side of X. I’m Sander from the Netherlands. All copyrights belong to their respective owners! DM for credits/removal/submission!

ooOOoo

Wonderful! Thanks Dordie!

The history of Oxygen!

A fascinating subject.

We take it for granted! Of that I am sure. But the question of how oxygen first came to be built up in our atmosphere is fascinating. There was a recent article written by Elizabeth Swanner, who is Associate Professor of Geology, Iowa State University that was published in The Conversation. It makes for a very interesting read.

ooOOoo

A layered lake is a little like Earth’s early oceans − and lets researchers explore how oxygen built up in our atmosphere billions of years ago

Researchers sample water from various layers to analyze back in the lab. Elizabeth Swanner, CC BY-ND

Elizabeth Swanner, Iowa State University

Little Deming Lake doesn’t get much notice from visitors to Itasca State Park in Minnesota. There’s better boating on nearby Lake Itasca, the headwaters of the Mississippi River. My colleagues and I need to maneuver hundreds of pounds of equipment down a hidden path made narrow by late-summer poison ivy to launch our rowboats.

But modest Deming Lake offers more than meets the eye for me, a geochemist interested in how oxygen built up in the atmosphere 2.4 billion years ago. The absence of oxygen in the deep layers of Deming Lake is something this small body of water has in common with early Earth’s oceans.

On each of our several expeditions here each year, we row our boats out into the deepest part of the lake – over 60 feet (18 meters), despite the lake’s surface area being only 13 acres. We drop an anchor and connect our boats in a flotilla, readying ourselves for the work ahead.

Smooth lake with boats in the distance against woodsy shoreline
Researchers’ boats on Deming Lake. Elizabeth Swanner, CC BY-ND

Deming Lake is meromictic, a term from Greek that means only partially mixing. In most lakes, at least once a year, the water at the top sinks while the water at the bottom rises because of wind and seasonal temperature changes that affect water’s density. But the deepest waters of Deming Lake never reach the surface. This prevents oxygen in its top layer of water from ever mixing into its deep layer.

Less than 1% of lakes are meromictic, and most that are have dense, salty bottom waters. Deming Lake’s deep waters are not very salty, but of the salts in its bottom waters, iron is one of the most abundant. This makes Deming Lake one of the rarest types of meromictic lakes.

man seated in small boat wearing gloves injecting water into a collection tube
Postdoc researcher Sajjad Akam collects a water sample for chemical analysis back in the lab. Elizabeth Swanner, CC BY-ND

The lake surface is calm, and the still air is glorious on this cool, cloudless August morning. We lower a 2-foot-long water pump zip-tied to a cable attached to four sensors. The sensors measure the temperature, amount of oxygen, pH and amount of chlorophyll in the water at each layer we encounter. We pump water from the most intriguing layers up to the boat and fill a myriad of bottles and tubes, each destined for a different chemical or biological analysis.

My colleagues and I have homed in on Deming Lake to explore questions about how microbial life adapted to and changed the environmental conditions on early Earth. Our planet was inhabited only by microbes for most of its history. The atmosphere and the oceans’ depths didn’t have much oxygen, but they did have a lot of iron, just like Deming Lake does. By investigating what Deming Lake’s microbes are doing, we can better understand how billions of years ago they helped to transform the Earth’s atmosphere and oceans into what they’re like now.

Layer by layer, into the lake

Two and a half billion years ago, ocean waters had enough iron to form today’s globally distributed rusty iron deposits called banded iron formations that supply iron for the modern global steel industry. Nowadays, oceans have only trace amounts of iron but abundant oxygen. In most waters, iron and oxygen are antithetical. Rapid chemical and biological reactions between iron and oxygen mean you can’t have much of one while the other is present.

The rise of oxygen in the early atmosphere and ocean was due to cyanobacteria. These single-celled organisms emerged at least 2.5 billion years ago. But it took roughly 2 billion years for the oxygen they produce via photosynthesis to build up to levels that allowed for the first animals to appear on Earth.

water concentrated on a filter looks pale green
Chlorophyll colors water from the lake slightly green. Elizabeth Swanner, CC BY-ND

At Deming Lake, my colleagues and I pay special attention to the water layer where the chlorophyll readings jump. Chlorophyll is the pigment that makes plants green. It harnesses sunlight energy to turn water and carbon dioxide into oxygen and sugars. Nearly 20 feet (6 meters) below Deming’s surface, the chlorophyll is in cyanobacteria and photosynthetic algae, not plants.

But the curious thing about this layer is that we don’t detect oxygen, despite the abundance of these oxygen-producing organisms. This is the depth where iron concentrations start to climb to the high levels present at the lake’s bottom.

This high-chlorophyll, high-iron and low-oxygen layer is of special interest to us because it might help us understand where cyanobacteria lived in the ancient ocean, how well they were growing and how much oxygen they produced.

We suspect the reason cyanobacteria gather at this depth in Deming Lake is that there is more iron there than at the top of the lake. Just like humans need iron for red blood cells, cyanobacteria need lots of iron to help catalyze the reactions of photosynthesis.

A likely reason we can’t measure any oxygen in this layer is that in addition to cyanobacteria, there are a lot of other bacteria here. After a good long life of a few days, the cyanobacteria die, and the other bacteria feed on their remains. These bacteria rapidly use up any oxygen produced by still photosynthesizing cyanobacteria the way a fire does as it burns through wood.

We know there are lots of bacteria here based on how cloudy the water is, and we see them when we inspect a drop of this water under a microscope. But we need another way to measure photosynthesis besides measuring oxygen levels.

Long-running lakeside laboratory

The other important function of photosynthesis is converting carbon dioxide into sugars, which eventually are used to make more cells. We need a way to track whether new sugars are being made, and if they are, whether it’s by photosynthetic cyanobacteria. So we fill glass bottles with samples of water from this lake layer and seal them tight with rubber stoppers.

We drive the 3 miles back to the Itasca Biological Station and Laboratories where we will set up our experiments. The station opened in 1909 and is home base for us this week, providing comfy cabins, warm meals and this laboratory space.

In the lab, we inject our glass bottle with carbon dioxide that carries an isotopic tracer. If cyanobacteria grow, their cells will incorporate this isotopic marker.

We had a little help to formulate our questions and experiments. University of Minnesota students attending summer field courses collected decades worth of data in Itasca State Park. A diligent university librarian digitized thousands of those students’ final papers.

My students and I pored over the papers concerning Deming Lake, many of which tried to determine whether the cyanobacteria in the chlorophyll-rich layer are doing photosynthesis. While most indicated yes, those students were measuring only oxygen and got ambiguous results. Our use of the isotopic tracer is trickier to implement but will give clearer results.

woman holds a clear plastic bag aloft, she and man are seated in boat
Graduate students Michelle Chamberlain and Zackry Stevenson about to sink the bottles for incubation in Deming Lake. Elizabeth Swanner, CC BY-ND

That afternoon, we’re back on the lake. We toss an anchor; attached to its rope is a clear plastic bag holding the sealed bottles of lake water now amended with the isotopic tracer. They’ll spend the night in the chlorophyll-rich layer, and we’ll retrieve them after 24 hours. Any longer than that and the isotopic label might end up in the bacteria that eat the dying cyanobacteria instead of the cyanobacteria themselves. We tie off the rope to a floating buoy and head back to the station’s dining hall for our evening meal.

Iron, chlorophyll, oxygen

The next morning, as we wait for the bottles to finish their incubation, we collect water from the different layers of the lake and add some chemicals that kill the cells but preserve their bodies. We’ll look at these samples under the microscope to figure out how many cyanobacteria are in the water, and we’ll measure how much iron is inside the cyanobacteria.

That’s easier said than done, because we have to first separate all the “needles” (cyanobacteria) from the “hay” (other cells) and then clean any iron off the outside of the cyanobacteria. Back at Iowa State University, we’ll shoot the individual cells one by one into a flame that incinerates them, which liberates all the iron they contain so we can measure it.

rowboat with one woman in it on a lake with woodsy shoreline
Biogeochemist Katy Sparrow rows a research vessel to shore. Elizabeth Swanner, CC BY-ND

Our scientific hunch, or hypothesis, is that the cyanobacteria that live in the chlorophyll- and iron-rich layer will contain more iron than cyanobacteria that live in the top lake layer. If they do, it will help us establish that greater access to iron is a motive for living in that deeper and dimmer layer.

These experiments won’t tell the whole story of why it took so long for Earth to build up oxygen, but they will help us to understand a piece of it – where oxygen might have been produced and why, and what happened to oxygen in that environment.

Deming Lake is quickly becoming its own attraction for those with a curiosity about what goes on beneath its tranquil surface – and what that might be able to tell us about how new forms of life took hold long ago on Earth.

Elizabeth Swanner, Associate Professor of Geology, Iowa State University

This article is republished from The Conversation under a Creative Commons license. Read the original article.

ooOOoo

Nothing I can add to this very erudite article. Please read it and be fascinated by the findings.

Just a rainbow!

Well, just two rainbows!

I just ran out of time yesterday to publish a proper blog post so I am sharing this photograph with you. It shows Mount Sexton in the distance, just to the right of the fir tree, and two rainbows, it being a rainy afternoon. The camera is facing North-East and the picture was taken at the north end of our rear deck.

These Heat Waves?

What is the truth?

Today, August 14th, here in Southern Oregon we are expecting 111 degrees Fahrenheit or 43.8 degrees C. That is really hot! (And at home it reached 108 deg. F. at 3pm.)

So it seems pertinent to republish a post from The Conversation that was published on July 21st, 2023.

ooOOoo

Is it really hotter now than any time in 100,000 years?

By Darrell Kaufman

Professor of Earth and Environmental Sciences, Northern Arizona University

As scorching heat grips large swaths of the Earth, a lot of people are trying to put the extreme temperatures into context and asking: When was it ever this hot before?

Globally, 2023 has seen some of the hottest days in modern measurements, but what about farther back, before weather stations and satellites?

Some news outlets have reported that daily temperatures hit a 100,000-year high. 

As a paleoclimate scientist who studies temperatures of the past, I see where this claim comes from, but I cringe at the inexact headlines. While this claim may well be correct, there are no detailed temperature records extending back 100,000 years, so we don’t know for sure.

Here’s what we can confidently say about when Earth was last this hot.

This is a new climate state

Scientists concluded a few years ago that Earth had entered a new climate state not seen in more than 100,000 years. As fellow climate scientist Nick McKay and I recently discussed in a scientific journal article, that conclusion was part of a climate assessment report published by the Intergovernmental Panel on Climate Change (IPCC) in 2021.

Earth was already more than 1 degree Celsius (1.8 Fahrenheit) warmer than preindustrial times, and the levels of greenhouse gases in the atmosphere were high enough to assure temperatures would stay elevated for a long time.

Earth’s average temperature has exceeded 1 degree Celsius (1.8 F) above the preindustrial baseline. This new climate state will very likely persist for centuries as the warmest period in more than 100,000 years. The chart shows different reconstructions of temperature over time, with measured temperatures since 1850 and a projection to 2300 based on an intermediate emissions scenario. D.S. Kaufman and N.P. McKay, 2022, and published datasets, Author provided

Even under the most optimistic scenarios of the future – in which humans stop burning fossil fuels and reduce other greenhouse gas emissions – average global temperature will very likely remain at least 1 C above preindustrial temperatures, and possibly much higher, for multiple centuries.

This new climate state, characterized by a multi-century global warming level of 1 C and higher, can be reliably compared with temperature reconstructions from the very distant past.

How we estimate past temperature

To reconstruct temperatures from times before thermometers, paleoclimate scientists rely on information stored in a variety of natural archives.

The most widespread archive going back many thousands of years is at the bottom of lakes and oceans, where an assortment of biological, chemical and physical evidence offers clues to the past. These materials build up continuously over time and can be analyzed by extracting a sediment core from the lake bed or ocean floor.

University of Arizona scientist Ellie Broadman holds a sediment core from the bottom of a lake on Alaska’s Kenai Peninsula. Emily Stone

These sediment-based records are rich sources of information that have enabled paleoclimate scientists to reconstruct past global temperatures, but they have important limitations.

For one, bottom currents and burrowing organisms can mix the sediment, blurring any short-term temperature spikes. For another, the timeline for each record is not known precisely, so when multiple records are averaged together to estimate past global temperature, fine-scale fluctuations can be canceled out.

Because of this, paleoclimate scientists are reluctant to compare the long-term record of past temperature with short-term extremes.

Looking back tens of thousands of years

Earth’s average global temperature has fluctuated between glacial and interglacial conditions in cycles lasting around 100,000 years, driven largely by slow and predictable changes in Earth’s orbit with attendant changes in greenhouse gas concentrations in the atmosphere. We are currently in an interglacial period that began around 12,000 years ago as ice sheets retreated and greenhouse gases rose.

Looking at that 12,000-year interglacial period, global temperature averaged over multiple centuries might have peaked roughly around 6,000 years ago, but probably did not exceed the 1 C global warming level at that point, according to the IPCC reportAnother study found that global average temperatures continued to increase across the interglacial period. This is a topic of active research.

That means we have to look farther back to find a time that might have been as warm as today.

The last glacial episode lasted nearly 100,000 years. There is no evidence that long-term global temperatures reached the preindustrial baseline anytime during that period.

If we look even farther back, to the previous interglacial period, which peaked around 125,000 years ago, we do find evidence of warmer temperatures. The evidence suggests the long-term average temperature was probably no more than 1.5 C (2.7 F) above preindustrial levels – not much more than the current global warming level.

Now what?

Without rapid and sustained reductions in greenhouse gas emissions, the Earth is currently on course to reach temperatures of roughly 3 C (5.4 F) above preindustrial levels by the end of the century, and possibly quite a bit higher.

At that point, we would need to look back millions of years to find a climate state with temperatures as hot. That would take us back to the previous geologic epoch, the Pliocene, when the Earth’s climate was a distant relative of the one that sustained the rise of agriculture and civilization.

ooOOoo

It is difficult to know what to say other than one hopes that Governments and country leaders recognise the situation and DO SOMETHING!

As Dr. Michael Mann put it in the last issue of The Humanist: “The only obstacles aren’t the laws of physics, but the flaws in our politics.

I have a son and a daughter in their early 50’s and a grandson who is 12. They, along with millions of other younger people, need action now.

Please!

Picture Parade Four Hundred and Ninety-Three

Hoping to be back to normal!

July 20th was my last post. Here are some of my own photographs taken while Maija, my daughter, Marius, her husband, and Morten, their son were with us. That was after Alex, my son, had come to see us in June.

Here is Morten, who spent hours caressing and fondling Brandy, our largest dog.

oooo

His other passion was exploring for gold. We have Bummer Creek flowing through the property. It is called ‘Bummer’ because as the locals would have it there is no gold to be found. But that didn’t stop Morten spending time looking for gold!

And this is Maija (photo slightly out of focus).

The next photo shows Maija and Morten strolling along the creek.

oooo

Above a shot showing Marius and Morten looking for the illusive metal!

I close with the Morten and Marius hoping to see a trace of gold in the gold-pan, and Maija looking on.

My next post will be on Tuesday.

Picture Parade Four Hundred and Ninety-Two

Rather than post nothing I have published the next Picture Parade. This time a series of fabulous photographs from jkm757 of Ugly Hedgehog.

The Retriever

“Look Ma, No paws! I’m Flying!”

Ready To Play

Spin Dry

Leader of the Pack

Flying Fido

Izzy

Airborne Beagle

Queen Of The Beach

Halfpint

The photos are fabulous. Thank you, ‘jkm‘.