I started writing this early morning last Friday, 10th May. It was prompted by a post then just in from Christine’s blog 350 or bust. I didn’t have the heart to republish it for a few days.
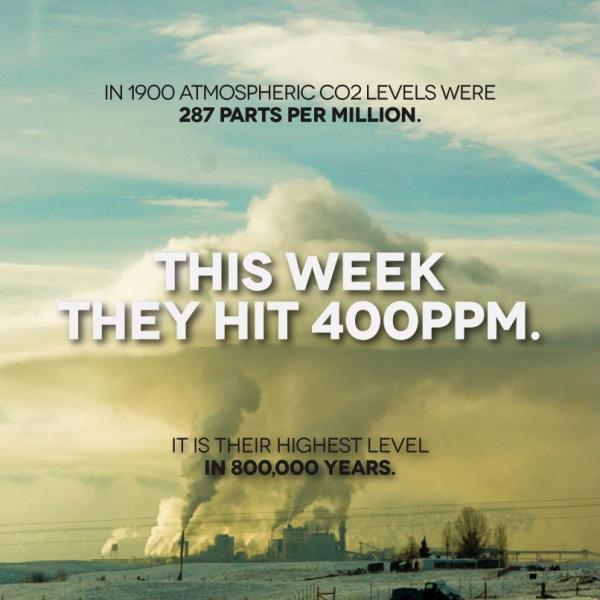
Then as the news of the atmospheric CO2 concentration passing 400 parts per million (ppm) moved more and more into mainstream news, I found myself morphing from sadness and puzzlement into anger and then into some form of determination to ‘do something‘, however insignificant that might be.
Because if humanity does not turn back from our carbon-based lifestyle pretty damn soon then those who are, say, 20 years or more younger than me (I’m 68), are in for some very tough, very rough times indeed.
So over the next two or three days, I shall focus on this topic simply from the motivation of wanting to join the numerous others around the world who are also recognising this moment in the history of man.
Ergo, for today that post from Christine. But I make no apologies for staying with the theme for much of this week.
oooOOOooo
Rolling The Dice: CO2 Concentration Hits Record High Amid Global Inaction On Climate Change
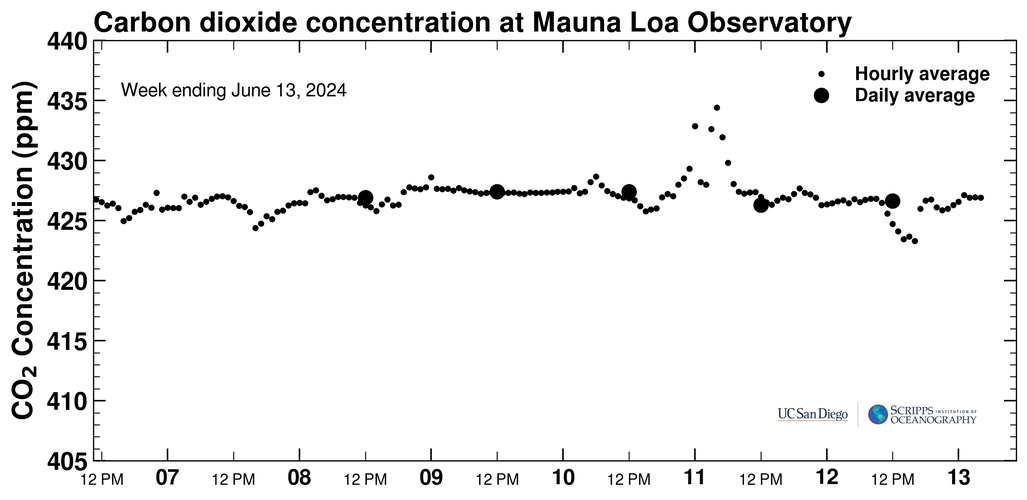
Readings at the US government’s Earth Systems Research laboratory in Hawaii, are not expected to reach their 2013 peak until mid May, but were recorded at a daily average of 399.72ppm on 25 April. The weekly average stood at 398.5 on Monday.
“I wish it weren’t true but it looks like the world is going to blow through the 400ppm level without losing a beat. At this pace we’ll hit 450ppm within a few decades,” said Ralph Keeling, a geologist with the Scripps Institution of Oceanography which operates the Hawaiian observatory.
*
*
Source: Scripps Institute of Oceanography
*
For more on the awful implications of this milestone in human history, check out the links below (hint: it isn’t good news for humans or animals or the ocean).
Now I did say this was going to be an odd assortment of posts for a few days!
Back in my ‘previous’ life in SW England and together with a group of friends we formed an online aviation briefing company, called AvBrief rather unimaginatively! The UK Met Office have their headquarters in Exeter, Devon and AvBrief had a commercial relationship with the Met Office.
Although no longer resident in the UK, I still subscribe to the UK Met Office blog and find many of their posts interesting. Such as this one that came in yesterday.
oooOOOooo
Cyclone twins form in the Indian Ocean by Dave Britton
11th May, 2013
April to June each year usually sees the transition from the southern to the northern hemisphere tropical cyclone season.
During this time it is possible to see cyclones in both hemispheres simultaneously. Furthermore, cyclone ‘twins’ sometimes develop at approximately the same longitude either side of the equator.
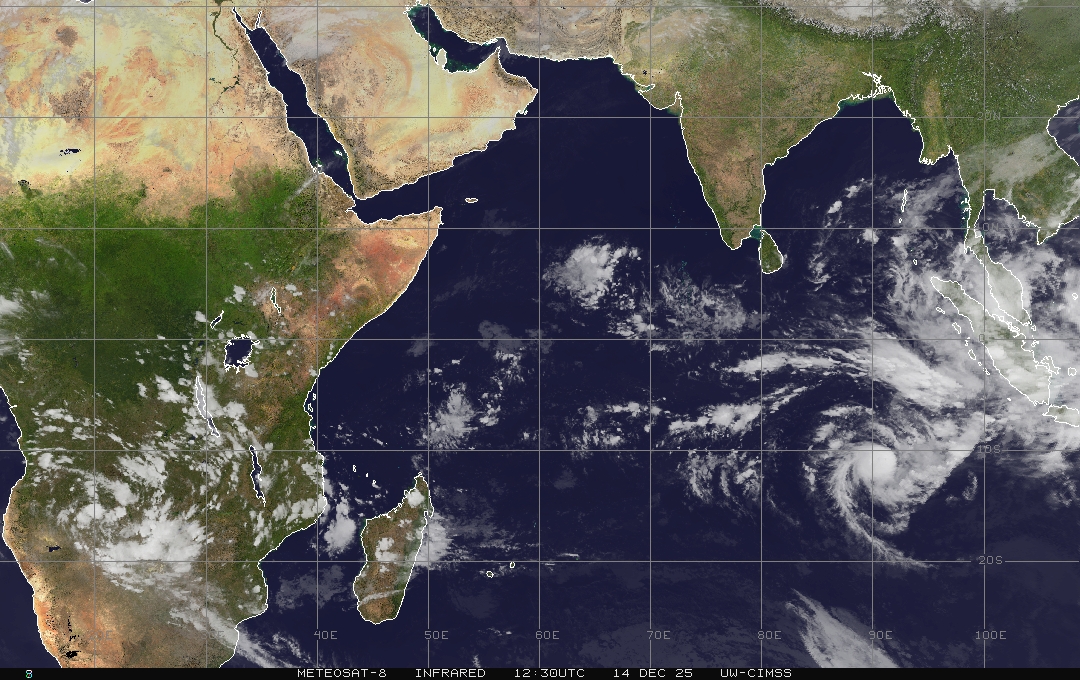
For the first time since 2009 cyclone twins have developed in the Indian Ocean.
This was caused by a strong burst of westerly winds along the equator about a week ago. A large mass of clouds located in the same area initially moved eastwards with the wind.
The clouds furthest from the equator then started to curl northwards in the northern hemisphere and southwards in the southern hemisphere due to the earth’s rotation. Over time these cloud masses have consolidated and started to rotate to produce twin tropical storms.
The southern hemisphere storm has been named Jamala and is currently not expected to affect any land areas.
The northern hemisphere storm has been named Mahasen and there is a stronger likelihood of this making landfall next week on one of the Bay of Bengal’s coastal regions.
The Met Office routinely supplies predictions of cyclone tracks from its global forecast model to regional meteorological centres worldwide, which are used along with guidance from other models in the production of forecasts and guidance.
You can keep up to date with tropical cyclones around the world on our website or follow us on Twitter.
You can see the latest image of Tropical Storms Jamala and Mahasen at:
How libertarian ideology is holding back our liberty to change.
Martin Lack, he of the popular blog Lack of Environment is taking a small break from his writings. In his own words,
I am afraid this may be the last post on this blog for a while because – what with the all the willful blindness and ideological prejudice that seems to stop people from recognising what an Eff-ing mess humanity is in – and my as yet unresolved employment situation – I am feeling somewhat emotionally drained. However, please don’t cancel your subscription (as who knows how quickly I may recover).
So what a pleasant surprise when less than a day after those words in came an email that read, “Since I have told readers of my blog that I am taking a rest, I offer you the text appended below to post on your blog instead (or not – as you see fit).”
On reading the text I most certainly ‘saw fit‘ to publish it!
It is a very interesting approach to climate science denialism resulting from an analysis of conspiracy theories.
So over to Martin.
oooOOOooo
Professor Stephan Lewandowsky.
Libertarian ideology is the real road block
I have recently been catching up on a bit of reading – focusing on the recent work of Professor Stephan Lewandowsky (and others). Following in the wake of James Hansen, Ben Santer and Michael Mann, Lewandowsky has recently been the target of hate-mail campaigns by climate change sceptics. Unlike all the others, however, Lewandowsky (formerly at the University of Western Australia but now at Bristol University in the UK) is not a climate scientist. This is how Bristol University announced his recent appointment.
Steve is an internationally renowned cognitive scientist who has joined us from the University of Western Australia. His research has already revolutionised our understanding of human memory and cognition, and he now stands poised to build upon his impressive body of work with a project as ambitious as it is timely. In particular, Steve’s intention to improve our understanding of how people choose to acquire information, and to use this understanding to help create a more informed populace, is a unique and much needed undertaking. Thus, this research offers enormous benefits in the fields of experimental psychology, climate research and the wider public engagement with and understanding of scientific research.
However, now that I have read them, the thing that strikes me most forcefully is not the stupidity of conspiracy “ideation”, the invocation of conspiracy theories, it is the fact that, as Lewandowsky et al acknowledge, their work confirms the findings of many previous studies; that climate change scepticism is associated with prejudicial adherence to libertarian ideology. Also key is that climate change scepticism can be predicted by that prejudicial adherence to libertarian ideology.
Amongst many other things, this explains why EU sceptics are climate sceptics and why the United Kingdom Independence Party (UKIP) do not like Wind Farms. I had understood this for some time. However, I had not fully realised its importance; it was just one theme among others. Anyone who has read my blog recently will probably have noticed my post about New World Order (NWO) conspiracy theory, in which I acknowledged that I had not realised just how significant such thinking is, and how subliminal and subconscious it may be.
Although adherence to free-market economics and libertarian ideology were themes I highlighted in my MA dissertation and in my subsequent book, and mentioned on my blog numerous times, everything I have read in the last few days points to one conclusion: We will not succeed in communicating the urgency of the need for radical changes in energy policy until we can convince people that climate scientists are not trying to perpetuate their research funding or halt human progress.
Professor Lewandowsky’s research shows that little can be achieved by simply telling people they are wrong. Far better is pointing out to people that Limits to Growth and Peak Oil have already halted the progress of globalised Capitalism, as recent times prove dramatically. In other words conveying facts to people rather than ideology.
I must admit that this has been a tough pill to swallow. I am not naturally progressive and certainly not naturally “liberal”. On the contrary, I am socially and politically conservative. However, the reality of anthropogenic climate disruption is a game-changer. Therefore, unlike members of the Flat Earth Society or Young Earth Creationists (YECs), I do not refuse to accept what scientists tell me simply because I don’t like the message.
We cannot defeat such obscurantism by telling people they are irrational; we can only defeat it by focusing on the evidence that suggests strongly that they are mistaken. To this end, I think the words of St Augustine of Hippo are an important consideration; words going back over 1,400 years before anyone started to question the Age of the Earth or the Origin of Species! Words echoed by Thomas Aquinas, (often quoted to those YECs):
“… since Holy Scripture can be explained in a multiplicity of senses, one should adhere to a particular explanation only in such measure as to be ready to abandon it if it be proved with certainty to be false, lest Holy Scripture be exposed to the ridicule of unbelievers, and obstacles be placed to their believing.”
– Thomas Aquinas, Summa Theologica (1273).
In the last 150 years or so, most Christians have now come to reject conspiracy theory explanations for fossils, for example, and have realised that it is inappropriate to treat the Bible as a scientific text book. Regretably, the main source of ideological blindness today is not conventional religion; it is adherence to free-market economics.
Therefore, it is important that we acknowledge the ideological nature of the communication problem we face. That is that the research by Prof Lewandowsky and others has discovered a tendency for libertarians to prefer conspiracy theories to reality. Perhaps, therefore, not surprising that he has been attacked; no-one likes to be told they are deluded.
Roadblocks to policy change will not be cleared by social and political scientists telling libertarians that they are deluded. All that will do is confirm their suspicions and reinforce their prejudices! No, what is needed is for climate scientists to be bolder in stating the facts.
The majority of climate scientists seem content to continue to soft-soap the issue; afraid of “telling it to people straight” because it may induce despair.
No, it is not too late to prevent an ecological catastrophe but I am certain that we are now very short of time and, as everyone from the International Energy Agency, the Pentagon and the IMF agree, further delay will not be cost-effective.
At the same time, I think social and political scientists need to focus on debunking the ‘New World Order’ conspiracy myth and pointing out the logical fallacy in the idea that all Greens are Communists in disguise (the so-called ‘Watermelons’).
The environment has become a political football when it is nothing of the kind. It is our life support system and we have pushed it near to the point of collapse, as E.F. Schumacher once said, by mistaking Nature’s capital for a form of income. Therefore, if we do not change course, bankruptcy would seem inevitable.
oooOOOooo
Having read and reflected on Martin’s essay, a couple of recollections surface. The first is Guy McPherson’s book Walking Away from Empire that I reviewed earlier this year then referred to in a recent republication of a George Monbiot essay:
So very difficult to pick out the sentence that carried the most power, for the essay is powerful from start to end. But this one did hit me in the face, “The impossibility of sustaining this system of endless, pointless consumption without the continued erosion of the living planet and the future prospects of humankind, is the conversation we will not have.“
Finally, I can’t resist reminding you, dear reader, of the point made by Prof. Guy McPherson in his book Walking Away from Empire, which I reviewed on March 6th. particularly in the first paragraph of the first chapter; Reason:
At this late juncture in the era of industry, it seems safe to assume we face one of two futures. If we continue to burn fossil fuels, we face imminent environmental collapse. If we cease burning fossil fuels, the industrial economy will collapse. Industrial humans express these futures as a choice between your money or your life, and tell you that, without money, life isn’t worth living. As should be clear by now, industrial humans — or at least our “leaders” — have chosen not door number one (environmental collapse) and not door number two (economic collapse), but both of the above.
The second recollection comes most recently; from yesterday’s The story of carbon. A story that showed the power of academic, peer-reviewed, properly conducted, rational science!
I will close with a repeat of the closing words from yesterday:
“By my calculation, we have a 5–10 year window to avoid the catastrophe. It won’t be easy — we’re past the point where any transition will be smooth — but we can make the transition and survive as a civilized species, humans in a recognizable world.”
I struggled for a while to decide what to call this post, the first of three. Explain why in just a moment.
The post is predominantly from the hand of a professional writer who goes under the name of Gaius Publius. He is described as contributing editor on AMERICAblog from where one also learns that:
Gaius Publius
Gaius Publius is a professional writer living on the West Coast of the United States. Gaius has written in a variety of genres and styles. He’s published short stories and poetry, books on education & technology, and is currently working on two book-length projects, including one novel.
In addition to writing, Gaius has been a professional educator and currently manages a small publishing consultancy. He holds a Bachelors degree in Great Books with a side concentration in physics and math, and a Masters in English and Communication.
A web search soon comes across a blog where there is a collection of the gentleman’s works.
OK, back to the theme.
Five days ago I read an essay on Yves Smith’s Naked Capitalism blog that struck me as a fabulously bold and clear presentation of the climate crisis. The essay, written by Gaius, also derived a positive message from the boldness and clarity of the argument. I dropped Yves an email asking for permission to republish on Learning from Dogs and not only did I get a quick reply from Yves, that reply included approval for the reposting from Mr. Publius. Thank you both.
The essay was called: The climate crisis in three easy charts. However, I was uncomfortable that the word ‘crisis’ might be a turn-off in a blog post title, so opted for The story of carbon. So with that off my chest, let me go straight to the essay as it appeared on Naked Capitalism.
oooOOOooo
The Climate Crisis in Three Easy Charts
Yves here. This post is the first in a series by Gaius. It starts by looking at the larger climate picture over larger swathes of time and showing what level of temperature changes led to mass extinction events.
I’m preparing to pivot back to climate crisis, starting with some reformatting of the earlier Climate Series posts — the transition to WordPress wasn’t kind to them — and the organization of this material into book form. (There’s also a climate-themed novel in the works; thriller fans, stay tuned.)
As a result, I’m doing serious study to refine both the concepts (or rather, the explanation of them) and the dating of coming events (the crisis in its various stages).
The first part of that pivot includes two media appearances this week. I’ll be on Virtually Speaking With Jay Ackroyd this Thursday (May 2) at 9 pm ET to discuss climate crisis for a full hour, followed by a Sunday appearance with Avedon Carol as part of the Virtually Speaking Sundays weekly media panel.
It’s the climate discussion I want to focus on here, and I’d like to do it by focusing on three diagrams and a few references back to my earlier climate pieces.
Climate catastrophe will usher in a new geologic era
Long-scale earth history is divided into Eons, then Eras, then Periods. But in fact, prior to the Cambrian Period, when life on earth exploded in number and variety, earth history is the story of non-life or small single- or multi-celled life. And starting with the Cambrian period, there’s just one “eon” anyway. It’s eras and periods we care about.
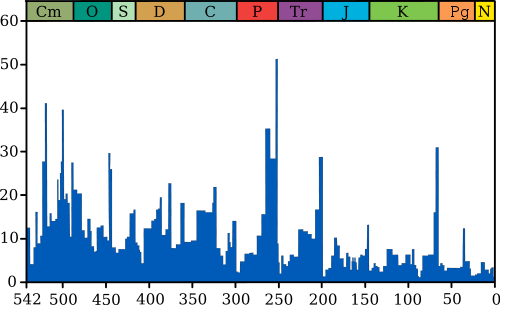
So let’s start there, with the Cambrian Period and the flourishing of life on earth. Consider the chart below:
The divisions across the top are geologic periods, starting with the Cambrian (“Cm”), the period of “visible life”‘ — meaning a proliferation of hardshelled species. It’s the big explosion of life on earth. The numbers across the bottom are millions of years ago. The spikes show extinction events, with the percentage of marine species going extinct expressed on the vertical or Y axis.
The chart doesn’t call them out, but starting with the Cambrian period, we’ve had three geologic eras (the larger divisions):
Paleozoic Era — “old life” Mesozoic Era — “middle life” or the Age of Reptiles (dino days) Cenozoic Era — “new life” or the Age of Mammals (including us)
The Paleozoic Era runs from the start of the graph to the big spike at 250 million years ago on the X axis. It encompasses six geologic periods and ended in the greatest mass extinction event on the planet — geologists call it the “Great Dying”.
The Mesozoic Era runs from the Great Dying at 250 million years ago to the big spike at 65 million years ago, the event that wiped out the dinosaurs — and every other large species. That cleared the way for mammals to grow big and thrive.
We’re now in the Cenozoic Era. Keep those transitions in mind — when mass extinctions change which groups of species can evolve and rule, it’s the end of an era and the start of another. Now look at the chart again. The whole chart shows 540 million years, and just three geologic eras. The next extinction event on the scale of the one at 250 million years ago, or the one at 65 million years ago, will change the shape of life on earth and usher in a new era. Ready for that?
Great question — where does man fit in? Answer: We come in very late.
First, notice the last three geologic “periods” at the top-right in the chart above. The period marked “K” is the Cretaceous, the period at the end of the Mesozoic Era. The next period (“Pg”) is the Paleogene, the one that marks the start of the Cenozoic (new life) Era. The period after that (“N”) is the Neogene, which ended just 2 million years ago. The period after that, not shown, is the Quarternary Period, our current one.
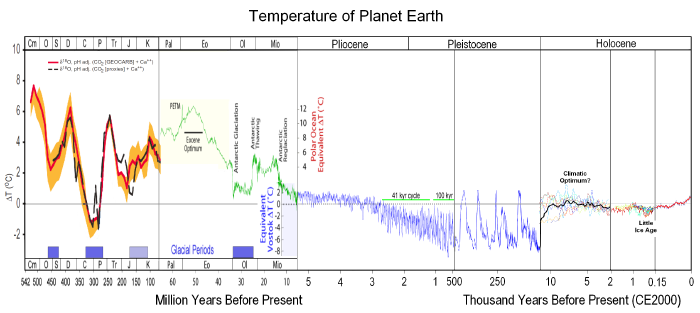
The Neogene-Quarternary boundary is the start of the time of great glaciers, and the best way to show that is with the chart below, showing earth temperatures mapped across the geologic periods (at the left end) and geologic epochs (the rest of the chart).
Click here to open the full version in another tab. It’s a big, interesting chart. (Source here.)
First, get oriented. On the Y axis is global temperature using change — in °C — from global temperature in the year 1800 as the norm or zero mark. (The global pre–Industrial Revolution temperature is generally the mark from which other global temperatures are measured, unless otherwise noted. To convert from °C to °F, just double the number; you’ll be pretty close.)
On the X axis, the first big division — from 542 million years ago to 65 million years ago — represents the first two geologic eras, the Paleozoic and Mezozoic (which unfortunately aren’t called out on this chart). “K” at the top and bottom is still the Cretaceous Period, and the end of the Cretaceous Period is also the end of the dinos and the end of the Mesozoic Era.
In this respect, both charts are the same. Man hasn’t showed up yet — our mammal ancestors were the equivalent of field mice in that world, small prey with soft shells and hiding skills.
But before we look at the rest of the X axis, notice that in the left-most part of the chart, the Y axis shows a huge change in global temperature relative to pre-Industrial norms. Looks like a monster spike, especially the first one, doesn’t it?
The Cambrian temperature spike is 6–8°C (about 11–14°F) higher than pre-Industrial levels.
It’s also the temperature we’re headed for by 2100.
But let’s not get distracted. Let’s set some markers in this chart in the horizontal (time) dimension. The whole rest of the chart — the part after the period called “K” — shows the Cenozoic Era (“new life” or Age of Mammals). From here to the right, the chart’s subdivisions show Epochs, which are sub-parts of Periods.
[Update: For a chart that shows the relationship between eras, periods and epochs, click here. it will help you stay oriented.]
Jump through the next five divisions — the epochs marked “Pal” through “Pliocene”. That takes you through the Neogene Period (“N” in the first chart) and to the start of the modern Quarternary Period, the one we’re in, and the one we’re interested in.
The epoch of the Pleistocene, which starts the Quarternary Period (again, see the chart), is the great age of glaciers. Homo habilis evolves at this time, a little over 2 million years ago. Homo erectus evolves shortly afterward. Each starts in Africa — now you can probably guess why — and each leaves Africa and spreads across the globe. (Homo erectus, by the way, lasts a long time on this earth. Longer than us by a lot.)
Homo sapiens evolved much later, in the Pleistocene — the age of glaciers, remember — just 250 thousand years ago, almost died out in Africa, but rebuilt our numbers, then spread out of Africa like our cousins. Because that was the glacier age, we’re still hunter-gatherers like the the rest of our cousins. The big beasts of the earth are creatures like woolly mammoths and sabre-tooth tigers, and we’re all alive on a fairly frozen planet with glaciers coming and going.
At the end of the Pleistocene is another extinction event. At the same time that the last glaciers recede (see chart), the big mammoths and tigers (et al) die off. Simultaneous with a noticeable change in climate, what we call “human civilization” begins. You can see that above, around 12–10 thousand years ago as the planetary temperature stabilizes. From then until almost now, planetary temperature is pretty stable. Notice it doesn’t take much of a wobble to mark the “Little Ice Age”.
Just two more points to make in this piece and I’m done.
First the bad news
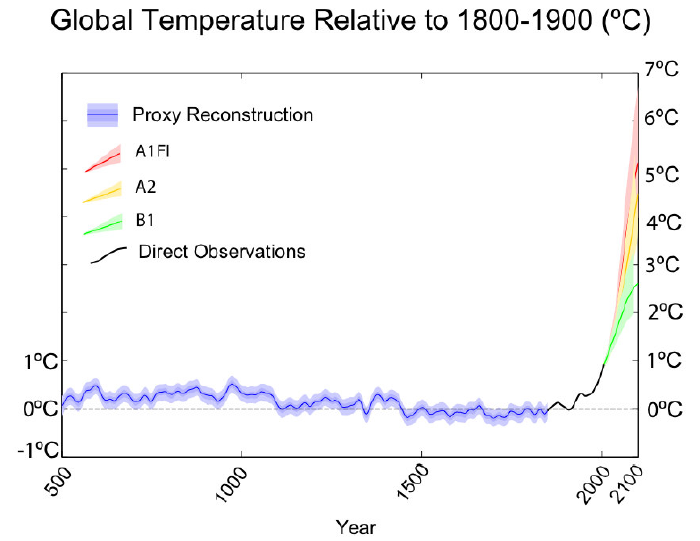
Folks, that little climb in temperature you see near the right end of the graph above is just the beginning. Remember the Cambrian spike at the left end of the graph? Take another look and note the increase — about 7°C. Now here’s Figure 21 from the Copenhagen Diagnosis, a report prepared by … oh … every single one of the world’s top climate scientists for the benefit of our world’s “leaders,” who met in 2009 to discuss how to pass the climate buck one more time:
What you see is temperatures from 500 AD to about 2000, with a number of prediction scenarios going forward. See the scenario called “A1FI”? It’s the one in red. That’s the one we’re on if we don’t stop spewing carbon. I call it the “do nothing” scenario — otherwise known as the “Keep David Koch Happy” scenario.
All you need to know? We’re on track for about +7°C — the peak temperature in the big Cambrian spike — by the year 2100.
Now the good news
Despite all this doom-and-gloom, it’s not over yet. Truly. By my calculation, we have a 5–10 year window to avoid the catastrophe. It won’t be easy — we’re past the point where any transition will be smooth — but we can make the transition and survive as a civilized species, humans in a recognizable world.
But two things are needed:
This has to be our top priority, which means you and everyone you know has to be fully aware and in full battle gear. (For reference, it’s called “hugging the monster.”)
It’s us vs. David Koch and all of his friends and enablers. Tackling any other enemy is tackling a dummy while the game is being played.
Educate your friends, and put a wrench into the Koch machine. How’s that not a plus?
If the Koch Bros keep getting rich, we move backward. If Barack “Hope & Change” Obama approves Keystone, we move backward. If the U.S. develops “domestic oil” resources, we move backward. For every new car (“carbon-delivery system”) sold, we move backward. People need to know this and think like this. We can stop the crisis, but only if we stop carbon. It’s that simple; and that stark.
But it’s also doable, and we’re the species that’s most equiped for “doable.” It’s what our big brains are for.
I’ll have more in the weeks and months ahead. I haven’t given up, not by a long shot. But you can’t pull out of a tail spin if you don’t admit you’re in one. Me, I think we can pull out.
oooOOOooo
So presumably if you are reading this, you have read the essay above. I hope so because while at first sight there appears to be much to take in, the story is clear, informed and powerful. You are unlikely to change the mind of a committed ‘denier’ but if there’s a little part of you that isn’t utterly clear about the risks ahead, then this essay is a fabulous opportunity to embrace clarity – and not to give up hope! Remember those words in the essay:
“By my calculation, we have a 5–10 year window to avoid the catastrophe. It won’t be easy — we’re past the point where any transition will be smooth — but we can make the transition and survive as a civilized species, humans in a recognizable world.”
Off the coast of Honduras, on a small island called Utila, lives a guy called Shane. Shane has broken away from all the social restraints and has built his own house. He is now building his own garden. However, he is doing it slightly different from most people — he uses cardboard boxes! This short film by Serena Aurora talks about Shane’s key concepts and tips on permaculture.
“It sometimes feels like a strange movie, you know, it’s all so weird that sometimes I wonder if it is really happening.”
This quote by Marshall Bruce Mathers III (born October 17, 1972), better known by his stage name Eminem, is so apt for today’s item. Because in so many places in so many countries, the weather ain’t what it used to be!
For example, in Grants Pass, Oregon, our local town, yesterday’s high was 86 deg F. (30 deg C.)! Then recently NOAA reported that:
According to NOAA scientists, the globally-averaged temperature for March 2013 tied with 2006 as the 10th warmest March since record keeping began in 1880. It also marked the 37th consecutive March and 337th consecutive month with a global temperature above the 20th century average.
So with all this in mind, I’m republishing a recent item on Climate Crocks, with the permission of Peter Sinclair.
oooOOOooo
Jet Stream Blows Winds of Change
April 19, 2013
I’ve been recovering from earth-month speaking-event whiplash, having criss crossed the state over recent days to talk about climate change, and what scientists are telling us.
Meanwhile, Paul Douglas, above, gave a brief summary of what we know about the extreme spring in the US, just before the current river of moisture hit across the nation’s midsection last night.
Near record setting flooding is hitting at my location, schools closed and evacuations underway. I got a bump from Jeff Masters last night about the situation, he is grappling with the big picture, will be posting more later today. For now, more concern about extreme weather knock-on effects – possible washing of dangerous invasive species into the Great Lakes water system.
The rains have brought the Des Plaines River on the east side of Chicago to major flood stage this morning, and a record flood crest is expected on Friday. The Asian Carp, a dangerous invasive species that would cost billions of dollars were it to get loose in the Great Lakes, is present in the Des Plaines River. Today’s flood event is capable of washing significant numbers of Asian Carp from the Des Plaines River into a canal that feeds directly into Lake Michigan, where they might be able to set up a breeding population capable of devastating the Great Lakes’ fishing industry. However, in October 2010, the U.S. Army Corps of Engineers completed the Des Plaines River barricade, a 13-mile-long system of concrete barriers and a specially fabricated wire mesh that allows water to flow through the fence but prevents the passage of fish. Hopefully, this barricade will withstand the flood and prevent Asian Carp from washing into Lake Michigan.
The Met Office has just released a report entitled “why was the start to spring 2013 so cold?”
–
The immediate cause was a natural climate fluctuation called the North Atlantic Oscillation (NAO). The NAO switches between two states, and this winter (in its negative phase) saw a southward shift of the jet stream, bringing cold air over the UK from northern Europe and Russia.
The Met Office identifies three other natural climate variations that may have made the negative NAO phase more likely.
One is the recent behaviour of another natural climate fluctuation, called the Madden-Julian Oscillation ( MJO). It was particularly strong during late February and March – often a sign that a negative NAO is on the way.
This winter also saw what’s called a Sudden Stratospheric Warming ( SSW) event, where winds in the stratosphere above the north pole reverse direction. This brought cold weather conditions to the UK.
Finally, Europe’s climate is influenced by another natural climate system – the Atlantic Multi-decadal Oscillation ( AMO). While the influence on UK winters is unclear, the report suggests:
“[T]here is some evidence that the changes in Atlantic sea surface temperatures associated with the AMO, dispose the circulation to give drier than normal spring conditions over the UK and northern Europe.”
Arctic Amplification
What about the effects of human-caused climate change? One question that has been much discussed recently is whether the recent rapid decline in Arctic sea ice could contribute to a change in the UK’s weather.
“It is argued that amplification of global warming over the Arctic is reducing the equator to pole temperature gradient, thereby weakening the strength of the mid-latitude jet streams.”
This could allow cold Arctic air to push further south, over mid-latitude countries like the UK, and weather patterns could stay longer in one place.
The possibility of a link between the Arctic and UK weather appears to be gaining scientific support, but the Met Office acknowledges it’s still an “area of ongoing research”. The Met Office has told us it’s holding an “ informal workshop” in the next two to three months for leading UK scientists plus several international experts.
Multiple factors
While scientists are making progress in working out how climate change could influence the odds of abnormal weather, it would be unwise to attribute one year’s events to a single cause. The report points this out, noting that:
“…no single explanation can account for the cold conditions observed”.
The report also highlights that although this spring was unusually cold,”it is not unprecedented or outside the expected natural variability of our climate”.
Nevertheless, with what the Met Office describes as “particularly heightened interest” in recent weather, getting to grips with how climate change could be affecting things is important. Even if, as the Met Office suggests, the complexities of the UK weather make “communicating the science drivers more complicated and nuanced than some audiences may wish.”
oooOOOooo
So wherever you are, do try and watch the Chasing Ice film because the more we all see the truth of what’s happening the better we can embrace change; locally, regionally, and globably.
A real pleasure and privilege to republish this article from Mr. Monbiot.
For some time now I have subscribed to the articles published by The Permaculture Research Institute of Australia. From time to time references have been made to PRI articles here on Learning from Dogs.
Recently, I read a PRI essay that had been penned by George Monbiot. It was called The Great Unmentionable. It blew me away. So I took a deep breath and dropped George M. an email asking if I might republish it here. George was very gracious in giving me such permission.
Mr. George Monbiot.
First some background to George Monbiot for those who are unfamiliar with his work and his writings. As his website explains:
I had an unhappy time at university, and I now regret having gone to Oxford, even though the zoology course I took – taught, among others, by Richard Dawkins, Bill Hamilton and John Krebs – was excellent. The culture did not suit me, and when I tried to join in I fell flat on my face, sometimes in a drunken stupor. I enjoyed the holidays more: I worked on farms and as a waterkeeper on the River Kennet. I spent much of the last two years planning my escape. There was only one job I wanted, and it did not yet exist: to make investigative environmental programmes for the BBC.
After hammering on its doors for a year, I received a phone call from the head of the BBC’s natural history unit during my final exams. He told me: “you’re so fucking persistent you’ve got the job.” They took me on, in 1985, as a radio producer, to make wildlife programmes. Thanks to a supportive boss, I was soon able to make the programmes I had wanted to produce. We broke some major stories. Our documentary on the sinking of a bulk carrier off the coast of Cork, uncovering evidence that suggested it had been deliberately scuppered, won a Sony award.
We have offshored both our consumption and our perceptions
By George Monbiot
Every society has topics it does not discuss. These are the issues which challenge its comfortable assumptions. They are the ones that remind us of mortality, which threaten the continuity we anticipate, which expose our various beliefs as irreconcilable.
Among them are the facts which sink the cosy assertion, that (in David Cameron’s words) “there need not be a tension between green and growth.”
At a reception in London recently I met an extremely rich woman, who lives, as most people with similar levels of wealth do, in an almost comically unsustainable fashion: jetting between various homes and resorts in one long turbo-charged holiday. When I told her what I did, she responded, “oh I agree, the environment is so important. I’m crazy about recycling.” But the real problem, she explained, was “people breeding too much”.
I agreed that population is an element of the problem, but argued that consumption is rising much faster and – unlike the growth in the number of people – is showing no signs of levelling off. She found this notion deeply offensive: I mean the notion that human population growth is slowing. When I told her that birth rates are dropping almost everywhere, and that the world is undergoing a slow demographic transition, she disagreed violently: she has seen, on her endless travels, how many children “all those people have”.
As so many in her position do, she was using population as a means of disavowing her own impacts. The issue allowed her to transfer responsibility to other people: people at the opposite end of the economic spectrum. It allowed her to pretend that her shopping and flying and endless refurbishments of multiple homes are not a problem. Recycling and population: these are the amulets people clasp in order not to see the clash between protecting the environment and rising consumption.
In a similar way, we have managed, with the help of a misleading global accounting system, to overlook one of the gravest impacts of our consumption. This too has allowed us to blame foreigners – particularly poorer foreigners – for the problem.
When nations negotiate global cuts in greenhouse gas emissions, they are held responsible only for the gases produced within their own borders. Partly as a result of this convention, these tend to be the only ones that countries count. When these “territorial emissions” fall, they congratulate themselves on reducing their carbon footprints. But as markets of all kinds have been globalised, and as manufacturing migrates from rich nations to poorer ones, territorial accounting bears ever less relationship to our real impacts.
While this is an issue which affects all post-industrial countries, it is especially pertinent in the United Kingdom, where the difference between our domestic and international impacts is greater than that of any other major emitter. The last government boasted that this country cut greenhouse gas emissions by 19% between 1990 and 2008. It positioned itself (as the current government does) as a global leader, on course to meet its own targets, and as an example for other nations to follow.
But the cut the UK has celebrated is an artefact of accountancy. When the impact of the goods we buy from other nations is counted, our total greenhouse gases did not fall by 19% between 1990 and 2008. They rose by 20%. This is despite the replacement during that period of many of our coal-fired power stations with natural gas, which produces roughly half as much carbon dioxide for every unit of electricity. When our “consumption emissions”, rather than territorial emissions, are taken into account, our proud record turns into a story of dismal failure.
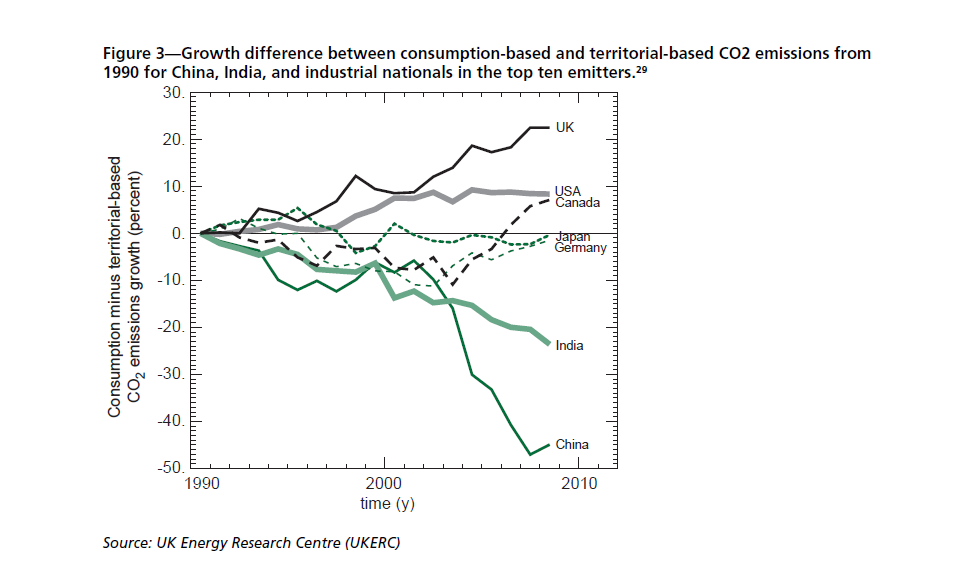
There are two further impacts of this false accounting. The first is that because many of the goods whose manufacture we commission are now produced in other countries, those places take the blame for our rising consumption. We use China just as we use the population issue: as a means of deflecting responsibility. What’s the point of cutting our own consumption, a thousand voices ask, when China is building a new power station every 10 seconds (or whatever the current rate happens to be)?
But, just as our position is flattered by the way greenhouse gases are counted, China’s is unfairly maligned. A graph published by the House of Commons Energy and Climate Change Committee shows that consumption accounting would reduce China’s emissions by roughly 45%. Many of those power stations and polluting factories have been built to supply our markets, feeding an apparently insatiable demand in the UK, the US and other rich nations for escalating quantities of stuff.
The second thing the accounting convention has hidden from us is consumerism’s contribution to global warming. Because we consider only our territorial emissions, we tend to emphasise the impact of services – heating, lighting and transport for example – while overlooking the impact of goods. Look at the whole picture, however, and you discover (using the Guardian’s carbon calculator) that manufacturing and consumption is responsible for a remarkable 57% of the greenhouse gas production caused by the UK.
Unsurprisingly, hardly anyone wants to talk about this, as the only meaningful response is a reduction in the volume of stuff we consume. And this is where even the most progressive governments’ climate policies collide with everything else they represent. As Mustapha Mond points out in Brave New World, “industrial civilization is only possible when there’s no self-denial. Self-indulgence up to the very limits imposed by hygiene and economics. Otherwise the wheels stop turning”.
The wheels of the current economic system – which depends on perpetual growth for its survival – certainly. The impossibility of sustaining this system of endless, pointless consumption without the continued erosion of the living planet and the future prospects of humankind, is the conversation we will not have.
By considering only our territorial emissions, we make the impacts of our escalating consumption disappear in a puff of black smoke: we have offshored the problem, and our perceptions of it.
But at least in a couple of places the conjuring trick is beginning to attract some attention.
On April 16th, the Carbon Omissions site will launch a brilliant animation by Leo Murray, neatly sketching out the problem*. The hope is that by explaining the issue simply and engagingly, his animation will reach a much bigger audience than articles like the one you are reading can achieve.
(*Declaration of interest (unpaid): I did the voiceover).
On April 24th, the Committee on Climate Change (a body that advises the UK government) will publish a report on how consumption emissions are likely to rise, and how government policy should respond to the issue.
I hope this is the beginning of a conversation we have been avoiding for much too long. How many of us are prepared fully to consider the implications?
So very difficult to pick out the sentence that carried the most power, for the essay is powerful from start to end. But this one did hit me in the face, “The impossibility of sustaining this system of endless, pointless consumption without the continued erosion of the living planet and the future prospects of humankind, is the conversation we will not have.“
Finally, I can’t resist reminding you, dear reader, of the point made by Prof. Guy McPherson in his book Walking Away from Empire, which I reviewed on March 6th. particularly in the first paragraph of the first chapter; Reason:
At this late juncture in the era of industry, it seems safe to assume we face one of two futures. If we continue to burn fossil fuels, we face imminent environmental collapse. If we cease burning fossil fuels, the industrial economy will collapse. Industrial humans express these futures as a choice between your money or your life, and tell you that, without money, life isn’t worth living. As should be clear by now, industrial humans — or at least our “leaders” — have chosen not door number one (environmental collapse) and not door number two (economic collapse), but both of the above.
Maybe this is why we seem unable to have the conversation because to do so means we have to look at ourselves in the mirror. Each one of us, you and me, has to address something so deeply personal. Back to Prof. McPherson and page 177 of his book (my emphasis):
It’s no longer just the living planet we should be concerned about. It’s us. The moral question, then: What are you going to do about it?
For my money, Mr. Monbiot is yet another voice of reason in the wilderness; another voice that deserves to be followed. I say this because by way of introduction to his philosophy, he opens thus:
My job is to tell people what they don’t want to hear. That is not what I set out to do. I wanted only to cover the subjects I thought were interesting and important. But wherever I turned, I met a brick wall of denial.
Denial is everywhere. I have come to believe that it’s an intrinsic component of our humanity, an essential survival strategy. Unlike other species, we know that we will die. This knowledge could destroy us, were we unable to blot it out. But, unlike other species, we also know how not to know. We employ this unique ability to suppress our knowledge not just of mortality, but of everything we find uncomfortable, until our survival strategy becomes a threat to our survival.
“… until our survival strategy becomes a threat to our survival.”
I sense the growing of this threat to the point where maybe within less than a year the vast majority of open-minded, thinking individuals know the truth of where we are all heading.
Today’s post is devoted entirely to a recent email received from Bill McKibben of 350.org
oooOOOooo
Dear friends,
Once a year or so, I write a piece that I really want people to read.
Last year it was an article called “The Terrifying New Math of Global Warming,” which helped fuel the divestment campaign that is now blanketing the country and even spreading overseas. Now I have a new long piece, also in Rolling Stone, called “The Fossil Fuel Resistance” that I was hoping you would read.
Here’s a quick summary from the article:
After decades of scant organized response to climate change, a truly powerful movement is quickly emerging, around the country and around the world. It has no great charismatic leader, and no central organization; it battles on a thousand fronts, many of them very local and small. But taken together, it’s now big enough to matter, and it’s growing fast.
So you could call it by many names. But for me it’s the Fossil Fuel Resistance.
I hope you’ll spread it around, because I think it will help people understand a few things about the climate movement.
First, it shows that we’re in a much bigger struggle than the fight against Keystone, crucial as that is. Across the country and around the world people are taking on the fossil fuel industry in remarkable ways that are starting to add up.
Second, it’s shows that we’re becoming a much broader movement tactically and organizationally than we’re used to thinking about.
The old-line environmental groups are playing their part, but powerful leadership is coming from all kinds of communities. There are a bunch of profiles that accompany the piece, and they focus on heroes from Indigenous nations, environmental justice organizations, and the clean tech industry, each of people doing amazing work.
What I hoped to do with this article is move past restating the problem, which I think most people understand, and show how we are working together towards solutions.
Those solutions take many forms, and I hope you’ll read about them and share the article around so that we can start to bring more people into this resistance movement.
It’s not all good news, of course. We’re still losing this fight, as the temperature rises. But I want everyone to know that it is going to be a real fight. This piece, I hope will help spread the word, and build our movement even bigger. Click here to read and share: 350.org/Resistance
We can’t outspend the fossil fuel barons, but we can out organize them, if we get to work.
Bill McKibben
P.S. Just a heads up that we’re planning a big push on sending comments to the State Dept. over the next few days. I wanted to make sure you knew that was coming, after these emails about new articles and films.
I feel very guilty as I didn’t make a note of where I came across this film. Whoever highlighted the film, thank you! It’s truly beautiful. So, please, settle yourself down and be enthralled.
In March 1940, the author John Steinbeck and his friend, marine biologist Ed Ricketts, sailed down the coast of California and Mexico to the Sea of Cortez. “The abundance of life here gives one an exuberance,” they wrote, “a feeling of fullness and richness.”
Their stated purpose was to document the creatures that inhabit shallow waters and tide pools on the margins of the Sea of Cortez. But it became much more. In these mysterious, phosphorescent waters they sought an understanding of mankind’s relationship to the natural world and a wellspring of hope for a world headed toward war.
Looking beyond the events of the day, the two friends foresaw our rising impact on the oceans and the devastating impact that over fishing would have on this rich sea. And yet, in their journey, they encountered a periodic cooling of the eastern Pacific Ocean known as La Niña that can still set off an explosion of life.
Can the story of their journey inspire new efforts to preserve the Sea of Cortez? Down along the shores of western Mexico, the wind blows hot and dry. Beyond these barren landscapes, cold currents rush up from the deep and the ocean literally boils with life.
Following their journey down to the Sea of Cortez in March of 1940, John Steinbeck and Ed Ricketts searched for a way to describe what they saw. “Trying to remember this place,” they wrote, “is like trying to re-create a dream. It is fierce and hostile and sullen. The stone mountains pile up to the sky and there is little fresh water. But we know we must go back if we live, and we don’t know why.”
The Sea of Cortez is one of the most diverse marine ecosystems on the planet. It’s shaped by the cool waters of the California Current flowing into the warm tropics and by a complex undersea terrain that rises up along a chain of islands and sea mounts. It was the shorelines, between the desert and the deep, that drew John Steinbeck, the author, and Ed Ricketts, a marine biologist and expert on coastal ecosystems.
Ricketts’ book, “Between Pacific Tides,” is a classic study of the inter-tidal zones of the California coastline and the myriad creatures that live in shallow pools, clinging to rocks to sift the rich nutrients carried in by the tides. Steinbeck and Ricketts sought to extend this work to the Sea of Cortez and to explore ideas at the core of their friendship. They shared a belief that man’s fate, like that of the animals they saw, is linked to the health of the natural world. [Ed. my emphasis]
Ricketts is said to have inspired some of Steinbeck’s most memorable characters, including Doc in Cannery Row, and the preacher Jim Casy in The Grapes of Wrath, published a year before their voyage. Set against the backdrop of drought and economic depression, the book describes the dustbowl conditions that gripped the American heartland in the 1930’s. “Now the wind grew strong and hard and it worked at the rain crust in the corn fields. Little by little the sky was darkened by the mixing dust, and carried away. The wind grew stronger. The rain crust broke and the dust lifted up out of the fields and drove gray plumes into the air like sluggish smoke.”
In most years, southerly winds carry moisture into the midsection of the country from the Gulf of Mexico. In the 1930’s, according to a recent NASA study, those winds were diverted by a build up of warm water in the Western Atlantic and by a periodic cooling of the Eastern Pacific known as La Niña. This combination robbed the region of rain.
By the time Steinbeck and Ricketts began their journey, the historic backdrop had shifted to war. Fighting had engulfed Europe and was spreading to the western Pacific. While the United States was still officially neutral, American companies had begun supplying arms to the allied effort. In early 1940, John Steinbeck used money he earned from “The Grapes of Wrath” to hire a sardine boat called the Western Flyer. From Monterrey, California, he, his wife Carol, Ed Ricketts and a four-man crew headed south, charting a course along the Mexican coastline.
By all accounts, the journey was filled with adventure, camaraderie, and a sense of wonder at the diversity of living things they encountered. Over a six-week period, the two friends wrote journal entries, took notes on conversations, and catalogued specimens they collected on the way. They compiled these writings into a book: “Sea of Cortez, A Leisurely Journal of Travel and Research,” later changed to “The Log From the Sea of Cortez.”
The work amounts to a search for a way to understand nature, and humanity at large, in a world steadily coming apart at the seams.
Ed Ricketts
The film was released last Feb 28, 2013. Directed by Thomas Lucas, the Producers were John Friday, Thomas Lucas and Adam Ravetch.
oooOOOooo
Will end with a couple of personal reflections. First is that when I was invited out to Mexico for Christmas 2007 by Suzann and Don, I travelled to San Carlos, Mexico on the Eastern shores of the Sea of Cortez. San Carlos is a little under 300 miles south of the Arizonan border with Mexico and was where Jean had been living for many years. Meeting Jean changed my life forever! Here’s a picture of the Sea of Cortez through the rear door of Jean’s house in San Carlos.
Not the longest walk in the world to the beach!
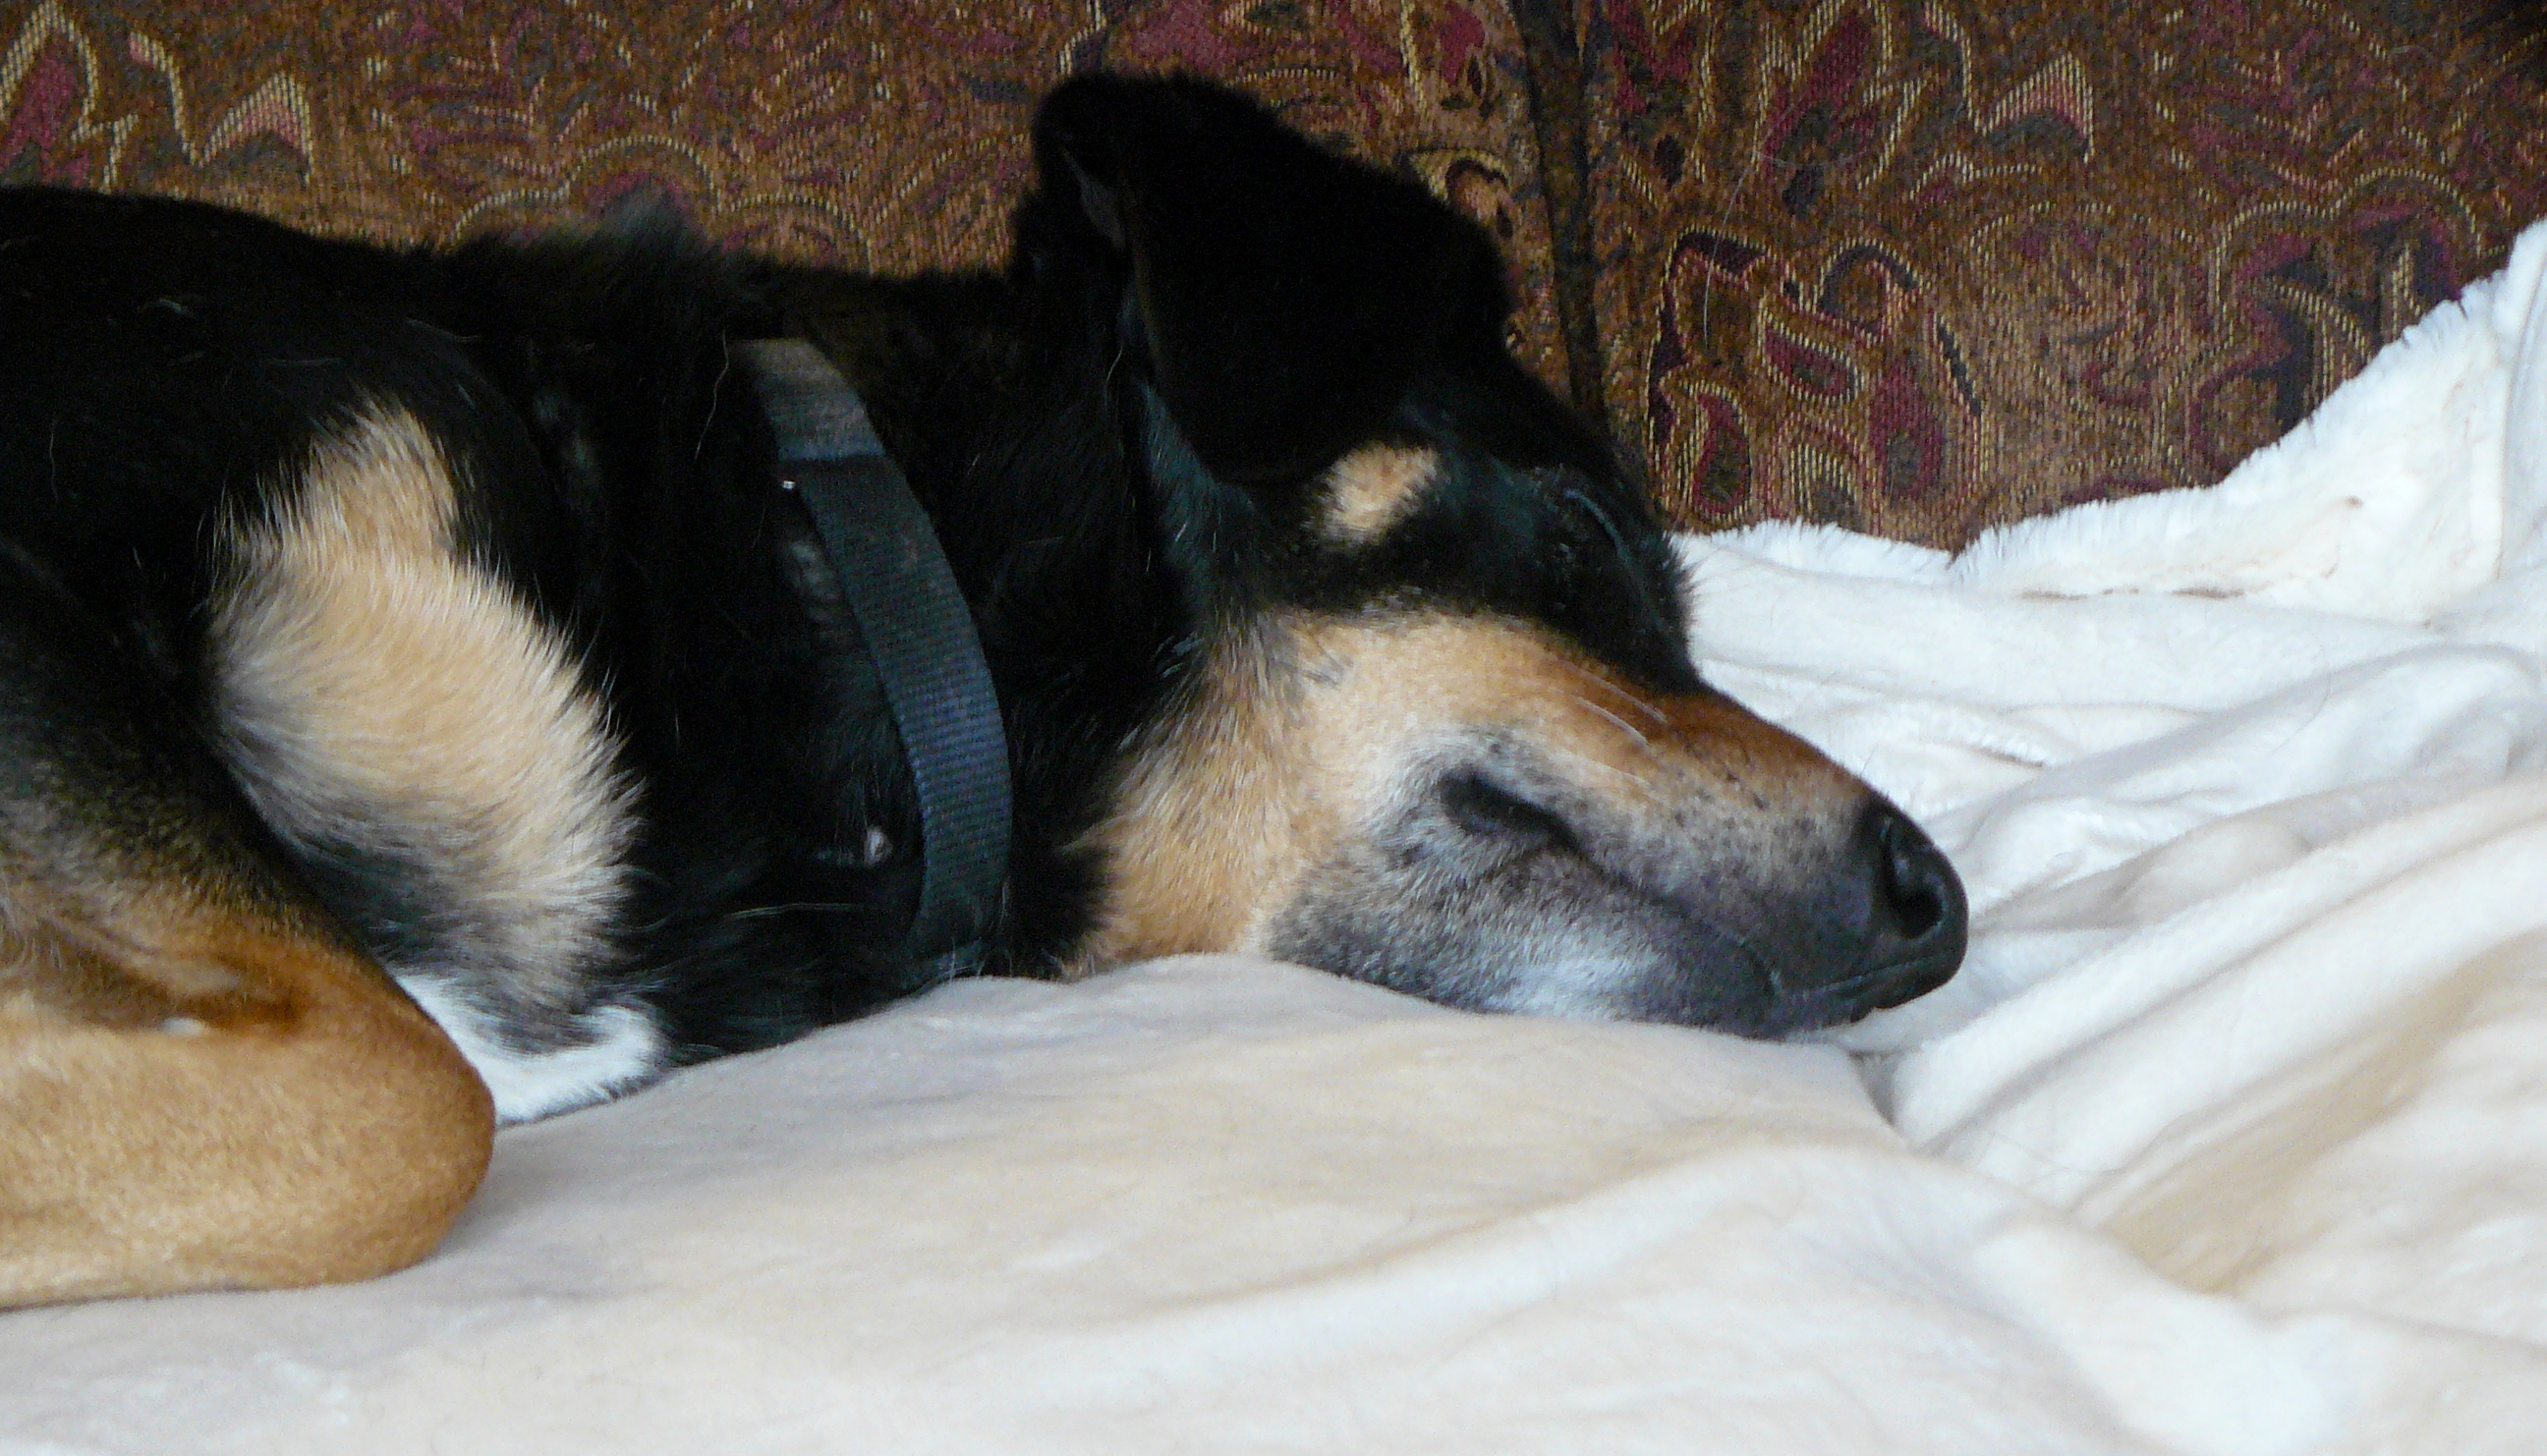
Second reflection is about dogs. Jean had spent many years rescuing Mexican feral dogs and finding homes for them; hundreds of them over her time in San Carlos. We brought 13 of those dogs with us when we moved to Arizona and 9 came to Oregon. Below is Hazel, one of the five remaining Mexican ‘rescue’ dogs that are still with us in Oregon.
A new study of ocean warming has just been published in Geophysical Research Letters by Balmaseda, Trenberth, and Källén (2013). There are several important conclusions which can be drawn from this paper.
Completely contrary to the popular contrarian myth, global warming has accelerated, with more overall global warming in the past 15 years than the prior 15 years. This is because about 90% of overall global warming goes into heating the oceans, and the oceans have been warming dramatically.
As suspected, much of the ‘missing heat’ Kevin Trenberth previously talked about has been found in the deep oceans. Consistent with the results of Nuccitelli et al. (2012), this study finds that 30% of the ocean warming over the past decade has occurred in the deeper oceans below 700 meters, which they note is unprecedented over at least the past half century.
Some recent studies have concluded based on the slowed global surface warming over the past decade that the sensitivity of the climate to the increased greenhouse effect is somewhat lower than the IPCC best estimate. Those studies are fundamentally flawed because they do not account for the warming of the deep oceans.
The slowed surface air warming over the past decade has lulled many people into a false and unwarranted sense of security.
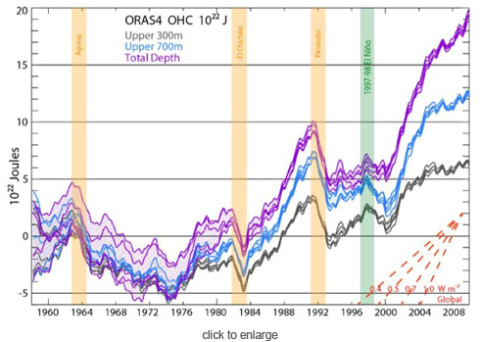
The main results of the study are illustrated in its Figure 1.
Figure 1: Ocean Heat Content from 0 to 300 meters (grey), 700 m (blue), and total depth (violet) from ORAS4, as represented by its 5 ensemble members. The time series show monthly anomalies smoothed with a 12-month running mean, with respect to the 1958–1965 base period. Hatching extends over the range of the ensemble members and hence the spread gives a measure of the uncertainty as represented by ORAS4 (which does not cover all sources of uncertainty). The vertical colored bars indicate a two year interval following the volcanic eruptions with a 6 month lead (owing to the 12-month running mean), and the 1997–98 El Niño event again with 6 months on either side. On lower right, the linear slope for a set of global heating rates (W/m2) is given.
The Data
In this paper, the authors used ocean heat content data from the European Centre for Medium-Range Weather Forecasts’ Ocean Reanalysis System 4 (ORAS4). A ‘reanalysis’ is a climate or weather model simulation of the past that incorporates data from historical observations. In the case of ORAS4, this includes ocean temperature measurements from bathythermographs and the Argo buoys, and other types of data like sea level andsurface temperatures. The ORAS4 data span from 1958 to the present, and have a high 1°x1° horizontal resolution, as well as 42 vertical layers. As the authors describe the data set,
“ORAS4 has been produced by combining, every 10 days, the output of an ocean model forced by atmospheric reanalysis fluxes and quality controlled ocean observations.”
Accelerated Global Warming
As illustrated in Figure 1 above, the study divides ocean warming into three layers for comparison – the uppermost 300 meters (grey), 700 meters (blue), and the full ocean depth (violet). After each of the Mt. Agung, Chichón, and Pinatubo volcanic eruptions (which cause short-term cooling by blocking sunlight), a distinct ocean cooling event is observed in the data. Additionally, after the very strong El Niño event of 1998, a cooling of the upper 300 and 700 meters of oceans is visible as a result of heat being transfered from the surface ocean to the atmosphere.
One of the clearest features in Figure 1 is the rapid warming of the oceans over the past decade. As we have previously discussed, the warming of the shallower oceans has slowed since around 2003, which certain climate contrarians have cherrypicked to try and argue that global warming has slowed. However, more heat accumulated in the deeper oceans below 700 meters during this period. The authors describe the ocean warming since 1999 as,
“the most sustained warming trend in this record of OHC. Indeed, recent warming rates of the waters below 700m appear to be unprecedented.”
Their results in this respect are very similar the main conclusion of Nuccitelli et al. (2012), in which we noted that recently, warming of the oceans below 700 meters accounts for about 30% of overall ocean and global warming. Likewise, this new study concludes,
“In the last decade, about 30% of the warming has occurred below 700 m, contributing significantly to an acceleration of the warming trend.”
Kevin Trenberth past comments about ‘missing heat’ drew considerable attention. The phrase refers to the fact that the heat accumulation on Earth since about 2004 (e.g. from warming oceans, air, and land, and melting ice) that instruments were able to measure could not account for the amount of global heat accumulation we expected to see, based on the energy imbalance caused by the increased greenhouse effect, as measured by satellites at the top of the Earth’s atmosphere.
These new estimates of deeper ocean heat content go a long way towards resolving that ‘missing heat’ mystery. There is still some discrepancy remaining, which could be due to errors in the satellite measurements, the ocean heat content measurements, or both. But the discrepancy is now significantly smaller, and will be addressed in further detail in a follow-up paper by these scientists.
So what’s causing this transfer of heat to the deeper ocean layers? The authors suggest that it is a result of changes in winds related to the negative phase of the Pacific Decadal Oscillation and more frequent La Niña events.
Good News for Climate Sensitivity? Probably Not
Recently there have been some studies and comments by a few climate scientists that based on the slowed global surface warming over the past decade, estimates of the Earth’s overall equilibrium climate sensitivity may be a bit too high. However, as we previously discussed, these studies and comments tend to neglect the warming of the deep oceans below 700 meters.
Does the warming of the deep ocean support these arguments for lower equilibrium climate sensitivity? Probably not, as Trenberth explained (via personal communication),
“it contributes to the overall warming of the deep ocean that has to occur for the system to equilibrate. It speeds that process up. It means less short term warming at the surface but at the expense of a greater earlier long-term warming, and faster sea level rise.”
So the slowed warming at the surface is only temporary, and consistent with the ‘hiatus decades’ described by Meehl et al. (2011). The global warming end result will be the same, but the pattern of surface warming over time may be different than we expect.
The real problem is that in the meantime, we have allowed the temporarily slowed surface warming to lull us into a false sense of security, with many people wrongly believing global warming has paused when in reality it has accelerated.
Global Warming Wake Up Call
Perhaps the most important result of this paper is the confirmation that while many people wrongly believe global warming has stalled over the past 10–15 years, in reality that period is “the most sustained warming trend” in the past half century. Global warming has not paused, it has accelerated.
The paper is also a significant step in resolving the ‘missing heat’ issue, and is a good illustration why arguments for somewhat lower climate sensitivity are fundamentally flawed if they fail to account for the warming of the oceans below 700 meters.
Most importantly, everybody (climate scientists and contrarians included) must learn to stop equating surface and shallow ocean warming with global warming. In fact, as Roger Pielke Sr. has pointed out, “ocean heat content change [is] the most appropriate metric to diagnose global warming.” While he has focused on the shallow oceans, actually we need to measure global warming by accounting for all changes in global heat content, including the deeper oceans. Otherwise we can easily fool ourselves into underestimating the danger of the climate problem we face.
oooOOOooo
“Global warming has not paused, it has accelerated.”
Now I should end it there. But I can’t!
American readers worried about the drought? Do watch this short video from Paul Douglas. (Apologies for the ad. at the start.)
For worldwide readers who have seen the massive changes in ‘normal’ weather this winter, take a look at this, first published on the NASA Earth Observatory website:
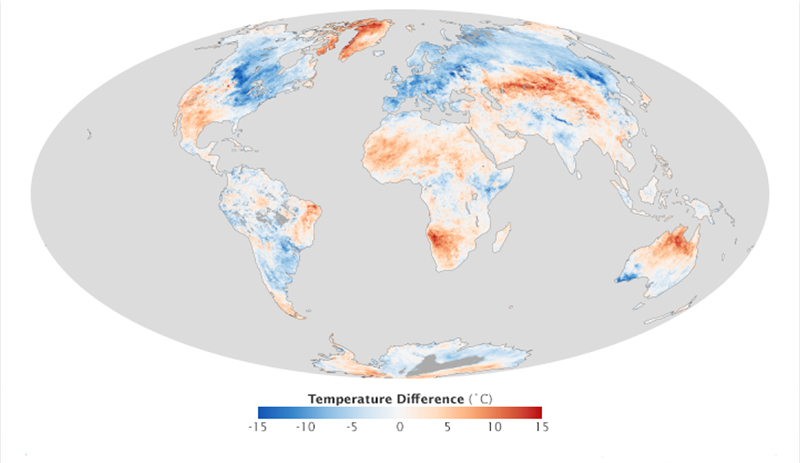
While a high-pressure weather system brought warmer than normal temperatures to Greenland and northern Canada in March 2013, much of North America, Europe, and Asia shivered through weeks of unseasonably cool temperatures. The contrasting temperatures are no coincidence: the same unusual pressure pattern in the upper atmosphere caused both events.
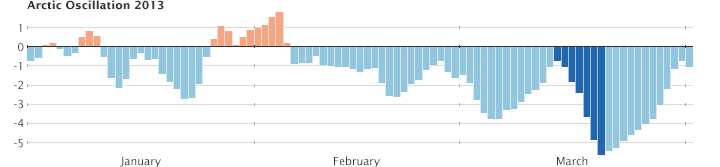
Atmospheric pressure patterns are constantly in flux, as air masses of differing temperatures and densities move around the skies. One key measure of pressure that meteorologists track closely is known as the Arctic Oscillation (AO) index, the difference in relative pressure between the Arctic and the mid-latitudes. Changes in the AO have can major impacts on weather patterns around the world.
When the AO index is in its “positive” phase, air pressure over the Arctic is low, pressure over the mid-latitudes is high, and prevailing winds confine extremely cold air to the Arctic. But when the AO is in its ”negative“ phase, the pressure gradient weakens. The pressure over the Arctic is not as low and pressure at mid-latitudes is not as high. In this negative phase, the AO enables Arctic air to flow to the south and warm air to move north.
In late March, the AO dropped as low as -5.6. (See this chart published by the Washington Post’s Capital Weather Gang to see how this compares with other periods when AO values reached record-low levels).
The temperature anomaly map above, based on data from the Moderate Resolution Imaging Spectroradiometer (MODIS) on NASA’s Aqua satellite, shows how this affected temperatures in the Northern Hemisphere. The map displays land surface temperature anomalies between March 14–20, 2013, compared to the same dates from 2005 to 2012. Areas with above-average temperatures appear in red and orange, and areas with below-average temperatures appear in shades of blue. Much of Europe, Russia, and the eastern United States saw unusually cool temperatures, while Greenland and Nunavut Territory were surprisingly warm for the time of year.
Many parts of the Northern Hemisphere saw near record-breaking cool temperatures as the value of the AO fell. The United Kingdom experienced its 4th coldest March since 1962. In late-March, two-thirds of weather stations in the Czech Republic broke records. Germany saw its coldest March since 1883. And Moscow had its coldest March since the 1950s.


