I struggled for a while to decide what to call this post, the first of three. Explain why in just a moment.
The post is predominantly from the hand of a professional writer who goes under the name of Gaius Publius. He is described as contributing editor on AMERICAblog from where one also learns that:
Gaius Publius
Gaius Publius is a professional writer living on the West Coast of the United States. Gaius has written in a variety of genres and styles. He’s published short stories and poetry, books on education & technology, and is currently working on two book-length projects, including one novel.
In addition to writing, Gaius has been a professional educator and currently manages a small publishing consultancy. He holds a Bachelors degree in Great Books with a side concentration in physics and math, and a Masters in English and Communication.
A web search soon comes across a blog where there is a collection of the gentleman’s works.
OK, back to the theme.
Five days ago I read an essay on Yves Smith’s Naked Capitalism blog that struck me as a fabulously bold and clear presentation of the climate crisis. The essay, written by Gaius, also derived a positive message from the boldness and clarity of the argument. I dropped Yves an email asking for permission to republish on Learning from Dogs and not only did I get a quick reply from Yves, that reply included approval for the reposting from Mr. Publius. Thank you both.
The essay was called: The climate crisis in three easy charts. However, I was uncomfortable that the word ‘crisis’ might be a turn-off in a blog post title, so opted for The story of carbon. So with that off my chest, let me go straight to the essay as it appeared on Naked Capitalism.
oooOOOooo
The Climate Crisis in Three Easy Charts
Yves here. This post is the first in a series by Gaius. It starts by looking at the larger climate picture over larger swathes of time and showing what level of temperature changes led to mass extinction events.
I’m preparing to pivot back to climate crisis, starting with some reformatting of the earlier Climate Series posts — the transition to WordPress wasn’t kind to them — and the organization of this material into book form. (There’s also a climate-themed novel in the works; thriller fans, stay tuned.)
As a result, I’m doing serious study to refine both the concepts (or rather, the explanation of them) and the dating of coming events (the crisis in its various stages).
The first part of that pivot includes two media appearances this week. I’ll be on Virtually Speaking With Jay Ackroyd this Thursday (May 2) at 9 pm ET to discuss climate crisis for a full hour, followed by a Sunday appearance with Avedon Carol as part of the Virtually Speaking Sundays weekly media panel.
It’s the climate discussion I want to focus on here, and I’d like to do it by focusing on three diagrams and a few references back to my earlier climate pieces.
Climate catastrophe will usher in a new geologic era
Long-scale earth history is divided into Eons, then Eras, then Periods. But in fact, prior to the Cambrian Period, when life on earth exploded in number and variety, earth history is the story of non-life or small single- or multi-celled life. And starting with the Cambrian period, there’s just one “eon” anyway. It’s eras and periods we care about.
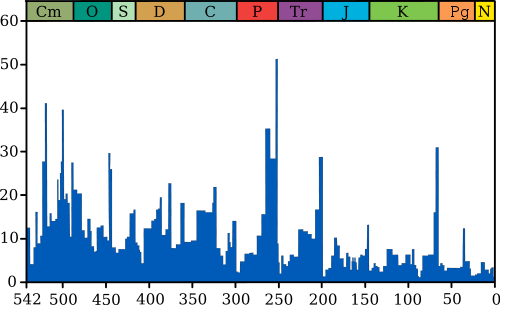
So let’s start there, with the Cambrian Period and the flourishing of life on earth. Consider the chart below:
The divisions across the top are geologic periods, starting with the Cambrian (“Cm”), the period of “visible life”‘ — meaning a proliferation of hardshelled species. It’s the big explosion of life on earth. The numbers across the bottom are millions of years ago. The spikes show extinction events, with the percentage of marine species going extinct expressed on the vertical or Y axis.
The chart doesn’t call them out, but starting with the Cambrian period, we’ve had three geologic eras (the larger divisions):
Paleozoic Era — “old life” Mesozoic Era — “middle life” or the Age of Reptiles (dino days) Cenozoic Era — “new life” or the Age of Mammals (including us)
The Paleozoic Era runs from the start of the graph to the big spike at 250 million years ago on the X axis. It encompasses six geologic periods and ended in the greatest mass extinction event on the planet — geologists call it the “Great Dying”.
The Mesozoic Era runs from the Great Dying at 250 million years ago to the big spike at 65 million years ago, the event that wiped out the dinosaurs — and every other large species. That cleared the way for mammals to grow big and thrive.
We’re now in the Cenozoic Era. Keep those transitions in mind — when mass extinctions change which groups of species can evolve and rule, it’s the end of an era and the start of another. Now look at the chart again. The whole chart shows 540 million years, and just three geologic eras. The next extinction event on the scale of the one at 250 million years ago, or the one at 65 million years ago, will change the shape of life on earth and usher in a new era. Ready for that?
Great question — where does man fit in? Answer: We come in very late.
First, notice the last three geologic “periods” at the top-right in the chart above. The period marked “K” is the Cretaceous, the period at the end of the Mesozoic Era. The next period (“Pg”) is the Paleogene, the one that marks the start of the Cenozoic (new life) Era. The period after that (“N”) is the Neogene, which ended just 2 million years ago. The period after that, not shown, is the Quarternary Period, our current one.
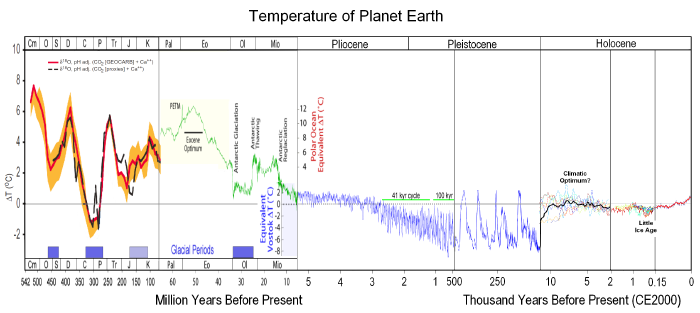
The Neogene-Quarternary boundary is the start of the time of great glaciers, and the best way to show that is with the chart below, showing earth temperatures mapped across the geologic periods (at the left end) and geologic epochs (the rest of the chart).
Click here to open the full version in another tab. It’s a big, interesting chart. (Source here.)
First, get oriented. On the Y axis is global temperature using change — in °C — from global temperature in the year 1800 as the norm or zero mark. (The global pre–Industrial Revolution temperature is generally the mark from which other global temperatures are measured, unless otherwise noted. To convert from °C to °F, just double the number; you’ll be pretty close.)
On the X axis, the first big division — from 542 million years ago to 65 million years ago — represents the first two geologic eras, the Paleozoic and Mezozoic (which unfortunately aren’t called out on this chart). “K” at the top and bottom is still the Cretaceous Period, and the end of the Cretaceous Period is also the end of the dinos and the end of the Mesozoic Era.
In this respect, both charts are the same. Man hasn’t showed up yet — our mammal ancestors were the equivalent of field mice in that world, small prey with soft shells and hiding skills.
But before we look at the rest of the X axis, notice that in the left-most part of the chart, the Y axis shows a huge change in global temperature relative to pre-Industrial norms. Looks like a monster spike, especially the first one, doesn’t it?
The Cambrian temperature spike is 6–8°C (about 11–14°F) higher than pre-Industrial levels.
It’s also the temperature we’re headed for by 2100.
But let’s not get distracted. Let’s set some markers in this chart in the horizontal (time) dimension. The whole rest of the chart — the part after the period called “K” — shows the Cenozoic Era (“new life” or Age of Mammals). From here to the right, the chart’s subdivisions show Epochs, which are sub-parts of Periods.
[Update: For a chart that shows the relationship between eras, periods and epochs, click here. it will help you stay oriented.]
Jump through the next five divisions — the epochs marked “Pal” through “Pliocene”. That takes you through the Neogene Period (“N” in the first chart) and to the start of the modern Quarternary Period, the one we’re in, and the one we’re interested in.
The epoch of the Pleistocene, which starts the Quarternary Period (again, see the chart), is the great age of glaciers. Homo habilis evolves at this time, a little over 2 million years ago. Homo erectus evolves shortly afterward. Each starts in Africa — now you can probably guess why — and each leaves Africa and spreads across the globe. (Homo erectus, by the way, lasts a long time on this earth. Longer than us by a lot.)
Homo sapiens evolved much later, in the Pleistocene — the age of glaciers, remember — just 250 thousand years ago, almost died out in Africa, but rebuilt our numbers, then spread out of Africa like our cousins. Because that was the glacier age, we’re still hunter-gatherers like the the rest of our cousins. The big beasts of the earth are creatures like woolly mammoths and sabre-tooth tigers, and we’re all alive on a fairly frozen planet with glaciers coming and going.
At the end of the Pleistocene is another extinction event. At the same time that the last glaciers recede (see chart), the big mammoths and tigers (et al) die off. Simultaneous with a noticeable change in climate, what we call “human civilization” begins. You can see that above, around 12–10 thousand years ago as the planetary temperature stabilizes. From then until almost now, planetary temperature is pretty stable. Notice it doesn’t take much of a wobble to mark the “Little Ice Age”.
Just two more points to make in this piece and I’m done.
First the bad news
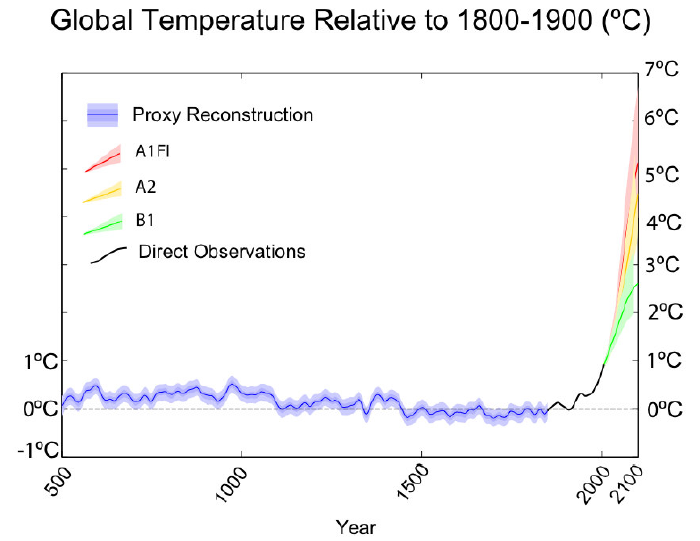
Folks, that little climb in temperature you see near the right end of the graph above is just the beginning. Remember the Cambrian spike at the left end of the graph? Take another look and note the increase — about 7°C. Now here’s Figure 21 from the Copenhagen Diagnosis, a report prepared by … oh … every single one of the world’s top climate scientists for the benefit of our world’s “leaders,” who met in 2009 to discuss how to pass the climate buck one more time:
What you see is temperatures from 500 AD to about 2000, with a number of prediction scenarios going forward. See the scenario called “A1FI”? It’s the one in red. That’s the one we’re on if we don’t stop spewing carbon. I call it the “do nothing” scenario — otherwise known as the “Keep David Koch Happy” scenario.
All you need to know? We’re on track for about +7°C — the peak temperature in the big Cambrian spike — by the year 2100.
Now the good news
Despite all this doom-and-gloom, it’s not over yet. Truly. By my calculation, we have a 5–10 year window to avoid the catastrophe. It won’t be easy — we’re past the point where any transition will be smooth — but we can make the transition and survive as a civilized species, humans in a recognizable world.
But two things are needed:
This has to be our top priority, which means you and everyone you know has to be fully aware and in full battle gear. (For reference, it’s called “hugging the monster.”)
It’s us vs. David Koch and all of his friends and enablers. Tackling any other enemy is tackling a dummy while the game is being played.
Educate your friends, and put a wrench into the Koch machine. How’s that not a plus?
If the Koch Bros keep getting rich, we move backward. If Barack “Hope & Change” Obama approves Keystone, we move backward. If the U.S. develops “domestic oil” resources, we move backward. For every new car (“carbon-delivery system”) sold, we move backward. People need to know this and think like this. We can stop the crisis, but only if we stop carbon. It’s that simple; and that stark.
But it’s also doable, and we’re the species that’s most equiped for “doable.” It’s what our big brains are for.
I’ll have more in the weeks and months ahead. I haven’t given up, not by a long shot. But you can’t pull out of a tail spin if you don’t admit you’re in one. Me, I think we can pull out.
oooOOOooo
So presumably if you are reading this, you have read the essay above. I hope so because while at first sight there appears to be much to take in, the story is clear, informed and powerful. You are unlikely to change the mind of a committed ‘denier’ but if there’s a little part of you that isn’t utterly clear about the risks ahead, then this essay is a fabulous opportunity to embrace clarity – and not to give up hope! Remember those words in the essay:
“By my calculation, we have a 5–10 year window to avoid the catastrophe. It won’t be easy — we’re past the point where any transition will be smooth — but we can make the transition and survive as a civilized species, humans in a recognizable world.”