The beat of a butterfly’s wings.
From Wikipedia:
The Butterfly Effect is a concept that small causes can have large effects. Initially, it was used with weather prediction but later the term became a metaphor used in and out of science.[1]
In chaos theory, the butterfly effect is the sensitive dependence on initial conditions in which a small change in one state of a deterministic nonlinear system can result in large differences in a later state. The name, coined by Edward Lorenz for the effect which had been known long before, is derived from the metaphorical example of the details of a hurricane (exact time of formation, exact path taken) being influenced by minor perturbations such as the flapping of the wings of a distant butterfly several weeks earlier. Lorenz discovered the effect when he observed that runs of his weather model with initial condition data that was rounded in a seemingly inconsequential manner would fail to reproduce the results of runs with the unrounded initial condition data. A very small change in initial conditions had created a significantly different outcome.
We all live in an interconnected world. Frankly, it’s such an obvious statement that one presumes that very few would not agree with the sentiment expressed within it.
But (and you knew there was a ‘but’ coming, didn’t you!) very few of us (and I include Jean and me to a very great extent) really understand, “A very small change in initial conditions had created a significantly different outcome.”
Take these few items; more or less randomly read over the last few days.
Such as this post over on Patrice Ayme’s blog.
Biblical Flood Starting Anew
Abstract: update on Sea Level Rise. The meat of the essay is at the end, in the section “THE SITUATION IS ACTUALLY CATACLYSMIC“.
Heard of The Flood? As in the Bible? Sea level rose 120 meters (400 feet), in the period centered around 10,000 years ago. The cause? More than half of Earth’s ice melted in a few millennia, During the rest of the early Holocene, the rate of rise of the world’s ocean reached peaks as high as 60 millimeters (2.5 inches) per year. The melting of the ice happened because Earth’s positional and orbital parameters had made northern hemisphere’s summers too warm (most of the ice shields rested on the large continents of the north). Nowadays only two enormous ice shields are left: Greenland and Antarctica.
Those who enjoy catastrophes will love it: we have 75 meters of further sea rise to enjoy pretty soon, on our way to a Jurassic climate (the Jurassic was characterized by gigantic warm shallow seas on top of the continents). Here was the situation in the Miocene, when CO2 was at 500 ppm (where we will be at in ten years, see conclusion below).
Patrice said that the essence, the meat, of his essay was at the end. Here are his closing words:
Three scientific papers published in the last two months support my, admittedly drastic, point of view. One observed the collapse of a colossal glacier in northwest Greenland, eaten by a current at one degree C. It was a miniature reproduction of what to expect for entire ice shields. Two others observed the past, and that Antarctica was unstable at 500 ppm CO2. What they did not say is how dramatic the situation was. Indeed, sounding moderate is how they get funded by a benevolent, plutocratically ruled government (and by government, I also mean the corrupt Supreme Court, not just the latest elected buffoons). The scientists who evoked the 500 ppm of CO2 omitted two significant details, where the devil lurks. They claimed that it would take 30 years to get there. That’s not correct; at the present rate, we will add 100 ppm of CO2 within 25 years. But not just that: there are other man-made GreenHouse Gases (GHG): CH4, NOx, Fluorocarbons, etc. All these gases warm up the lower atmosphere much more than CO2. So the correct measurement is not CO2 ppm, but CO2 EQUIVALENT ppm.
We are right now ABOVE 450 ppm in EQUIVALENT CO2, and will be at 500 ppm within ten years. Let’s hope there will be more boats than on the Titanic.
Patrice Ayme’
P/S: If anything, the preceding is a conservative estimate. Indeed very serious scientists evaluated already the man-made greenhouse gases at 478 ppm in 2013. This means we will be above 500 ppm in CO2 equivalent within six years, in line with my previous analyses, such as “Ten Years To Catastrophe“. See:
http://oceans.mit.edu/news/featured-stories/5-questions-mits-ron-prinn-400-ppm-threshold
Now it’s not all ‘doom and gloom’ and there is much that each and every one of us can do. More of that in Interconnections Three on Thursday.
But to continue with this ‘wake up call’ I’m going to republish in full an item that was recently published over on Mother Nature Network: 11 alarming facts about sea-level rise. To stop today’s post being excessively long, I’m going to split that MNN article over today and tomorrow. Here are the first 5 alarming facts. (Don’t read them just before turning the light out when going to bed tonight!)
ooOOoo
11 alarming facts about sea-level rise


The ocean is coming for us. Global sea levels are now rising by 3.4 millimeters per year, up from an average rate of 1.4 mm per year last century. In just 80 years, the ocean could be a full 1.3 meters (4.3 feet) taller than it is today.
That kind of planetary sea change can be hard to fathom — unless you live in a low-lying place like Miami, the Maldives or the Marshall Islands, where the effects of sea-level rise are already apparent. But within just a few decades, the problem will become unavoidable in major coastal cities around the world, from New Orleans, New York and Amsterdam to Calcutta, Bangkok and Tokyo.
We all know why this is happening. Rising seas are one of the most salient effects of man-made climate change, triggered by thermal expansion of seawater as well as the influx of melting glaciers. Yet many people still see it as a distant risk, failing to grasp how (relatively) quickly the sea is swallowing shores worldwide. And since half of all humans now live within 60 kilometers (37 miles) of a coast, this isn’t a niche issue.
To help put things in perspective, here’s a deeper look at the problem:
1. Global sea levels have already risen by 8 inches (200 mm) since 1880.
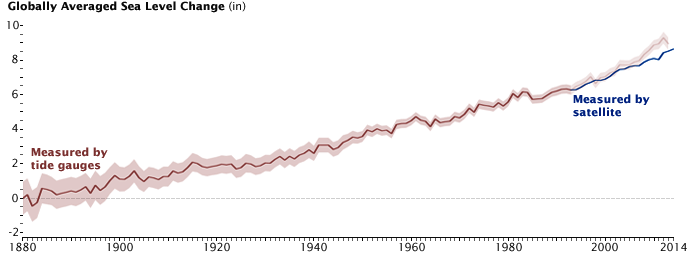
The chart above was produced by NASA’s Earth Observatory, based on data from the U.S. National Oceanic and Atmospheric Administration (NOAA) and Australia’s Commonwealth Scientific and Industrial Research Organization (CSIRO). Most of those historical data come from tide-gauge measurements, which are now complemented by satellite observations.
2. Not only are sea levels rising; the rate of their rise is rising.

On average, sea levels rose by 1.4 mm from 1900 to 2000. The yearly pace had surpassed 3 mm by 2010, and now it’s up to 3.4 mm per year.
3. That’s the fastest sea-level rise Earth has experienced in 3,000 years.
 If not for surging carbon dioxide in the atmosphere, sea levels should have only risen about an inch or two last century, and might have even fallen. Instead, thanks to the highest CO2 levels at any point in human history, global sea levels rose by 5.5 inches (14 cm) between 1900 and 2000. That’s the fastest oceanic advance in 27 centuries, according to a study published Feb. 22, and it’s still speeding up.
“The 20th century rise was extraordinary in the context of the last three millennia — and the rise over the last two decades has been even faster,” says lead author Robert Kopp, a climate scientist at Rutgers University, in a statement.
“Scenarios of future rise depend upon our understanding of the response of sea level to climate changes,” adds co-author Benjamin Horton. “Accurate estimates of sea-level variability during the past 3,000 years provide a context for such projections.”
4. Every vertical inch of sea-level rise moves the ocean 50 to 100 inches inland.

5. That’s already causing flood problems in many big coastal cities.
CLICK HERE TO SEE THE EFFECT ON BIG COASTAL CITIES
As the ocean invades coastal cities, the first signs of trouble are often urban saltwater floods. These can also happen naturally, though, so to determine the influence of rising seas, a new report by Climate Central models “alternative histories simulating the absence of anthropogenic climate change” at 27 U.S. tide gauges.
Out of 8,726 days since 1950 when unaltered water levels exceeded the National Weather Service thresholds for local “nuisance” floods, 5,809 didn’t exceed those thresholds in the alternative histories. “In other words,” the report explains, “human-caused global sea level rise effectively tipped the balance, pushing high-water events over the threshold, for about two-thirds of the observed flood days.”
Coastal flooding days have more than doubled in the U.S. since the 1980s, according to the report, in places ranging from Miami, Virginia Beach and New York to San Francisco, Seattle and Honolulu. According to a 2014 report, at least 180 floods will strike Annapolis, Maryland, during high tides every year by 2030 — sometimes twice a day. The same will be true for about a dozen other U.S. cities by 2045, not to mention many other low-lying urban areas around the world.
ooOOoo
To be continued tomorrow.
