
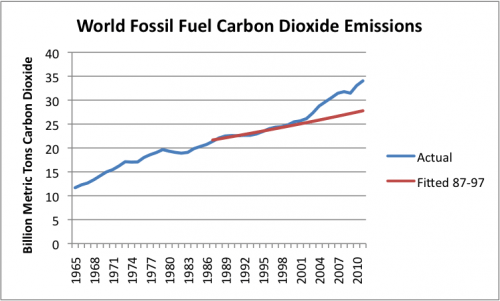
Figure 1. Actual world carbon dioxide emissions from fossil fuels, as shown in BP’s 2012 Statistical Review of World Energy. Fitted line is expected trend in emissions, based on actual trend in emissions from 1987-1997, equal to about 1.0% per year.
Dogs are animals of integrity. We have much to learn from them.
Figure 1. Actual world carbon dioxide emissions from fossil fuels, as shown in BP’s 2012 Statistical Review of World Energy. Fitted line is expected trend in emissions, based on actual trend in emissions from 1987-1997, equal to about 1.0% per year.
