Category: Technology

The building blocks of numbers

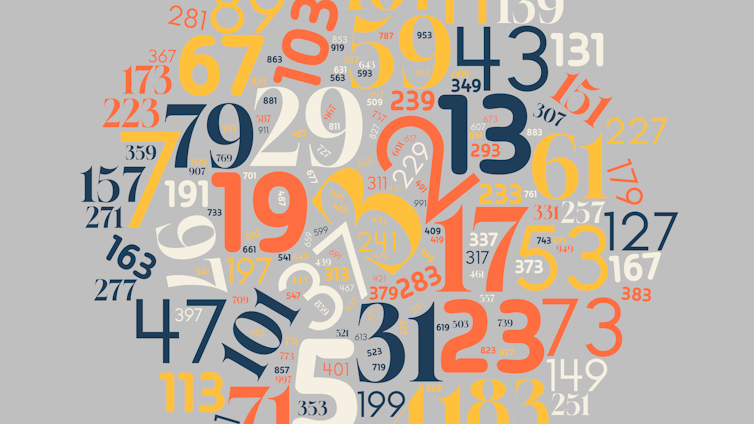
We are talking of prime numbers.

Science and mathematics have been a long interest of mine and I regret that I did not go to university to study science. But that was a long time ago!

However, thanks to The Conversation I can write about mathematics, in this case Prime Numbers.

ooOOoo

Prime numbers, the building blocks of mathematics, have fascinated for centuries − now technology is revolutionizing the search for them

Prime numbers are numbers that are not products of smaller whole numbers. Jeremiah Bartz

Jeremiah Bartz, University of North Dakota

A shard of smooth bone etched with irregular marks dating back 20,000 years puzzled archaeologists until they noticed something unique – the etchings, lines like tally marks, may have represented prime numbers. Similarly, a clay tablet from 1800 B.C.E. inscribed with Babylonian numbers describes a number system built on prime numbers.

As the Ishango bone, the Plimpton 322 tablet and other artifacts throughout history display, prime numbers have fascinated and captivated people throughout history. Today, prime numbers and their properties are studied in number theory, a branch of mathematics and active area of research today.

A history of prime numbers

A long, thin shard of bone with small lines scratched into it.
Some scientists guess that the markings on the Ishango bone represent prime numbers. Joeykentin/Wikimedia Commons, CC BY-SA

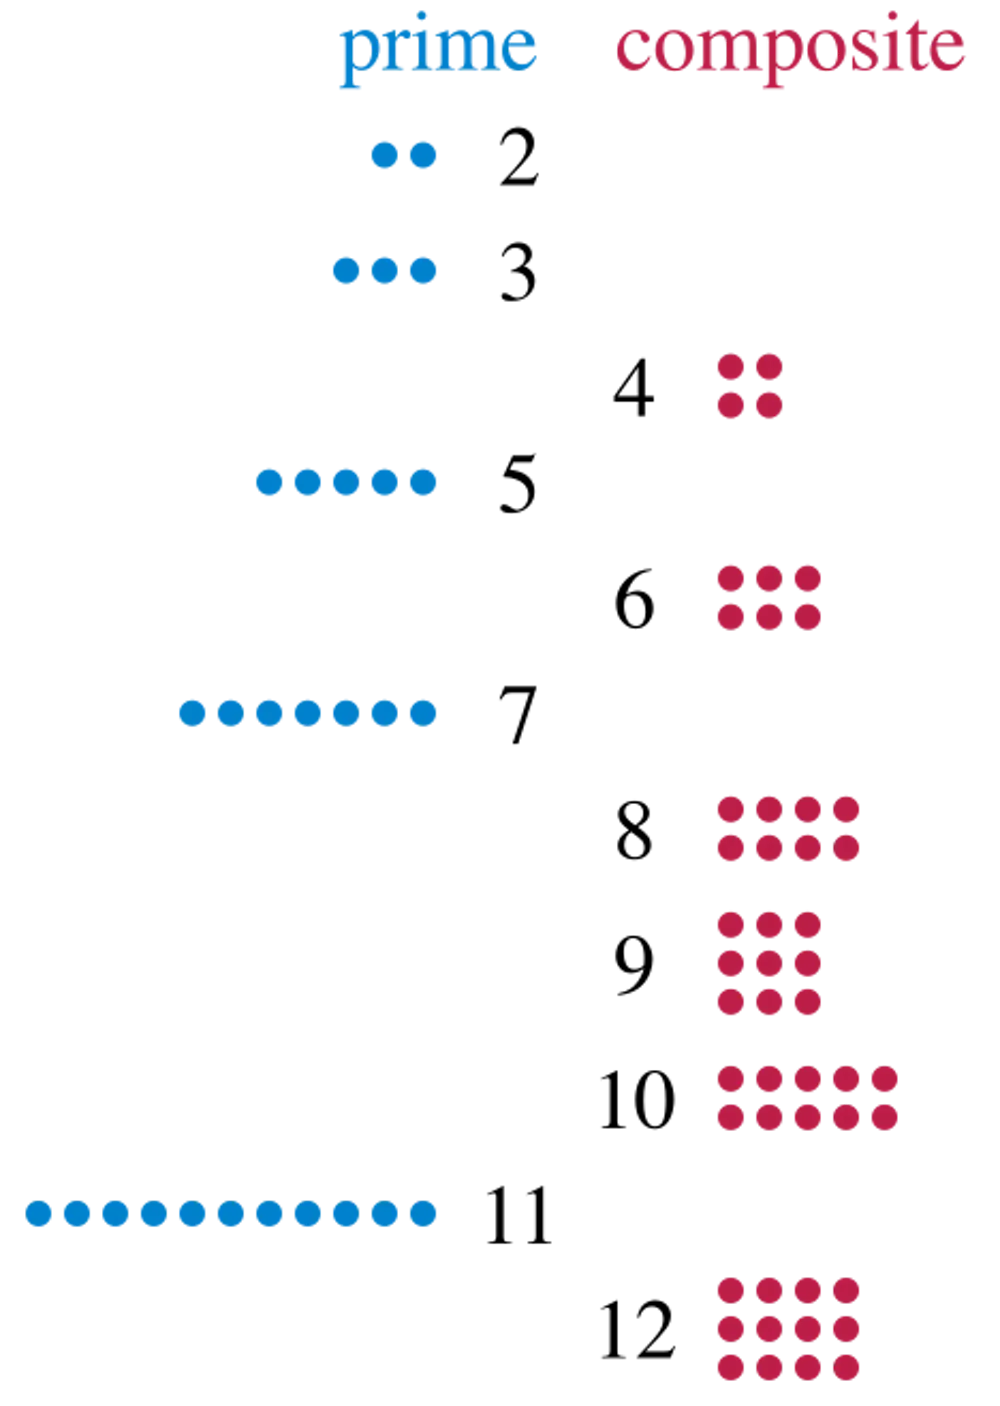
Informally, a positive counting number larger than one is prime if that number of dots can be arranged only into a rectangular array with one column or one row. For example, 11 is a prime number since 11 dots form only rectangular arrays of sizes 1 by 11 and 11 by 1. Conversely, 12 is not prime since you can use 12 dots to make an array of 3 by 4 dots, with multiple rows and multiple columns. Math textbooks define a prime number as a whole number greater than one whose only positive divisors are only 1 and itself.

Math historian Peter S. Rudman suggests that Greek mathematicians were likely the first to understand the concept of prime numbers, around 500 B.C.E.

Around 300 B.C.E., the Greek mathematician and logician Euler proved that there are infinitely many prime numbers. Euler began by assuming that there is a finite number of primes. Then he came up with a prime that was not on the original list to create a contradiction. Since a fundamental principle of mathematics is being logically consistent with no contradictions, Euler then concluded that his original assumption must be false. So, there are infinitely many primes.

The argument established the existence of infinitely many primes, however it was not particularly constructive. Euler had no efficient method to list all the primes in an ascending list.

a diagram showing prime numbers as dots in rows, with composite numbers as dots arranged in rectangles of at least two rows of dots, with the same number of dots in each row.
Prime numbers, when expressed as that number of dots, can be arranged only in a single row or column, rather than a square or rectangle. David Eppstein/Wikimedia Commons

In the middle ages, Arab mathematicians advanced the Greeks’ theory of prime numbers, referred to as hasam numbers during this time. The Persian mathematician Kamal al-Din al-Farisi formulated the fundamental theorem of arithmetic, which states that any positive integer larger than one can be expressed uniquely as a product of primes.

From this view, prime numbers are the basic building blocks for constructing any positive whole number using multiplication – akin to atoms combining to make molecules in chemistry.

Prime numbers can be sorted into different types. In 1202, Leonardo Fibonacci introduced in his book “Liber Abaci: Book of Calculation” prime numbers of the form (2p – 1) where p is also prime.

Today, primes in this form are called Mersenne primes after the French monk Marin Mersenne. Many of the largest known primes follow this format.

Several early mathematicians believed that a number of the form (2p – 1) is prime whenever p is prime. But in 1536, mathematician Hudalricus Regius noticed that 11 is prime but not (211 – 1), which equals 2047. The number 2047 can be expressed as 11 times 89, disproving the conjecture.

While not always true, number theorists realized that the (2p – 1) shortcut often produces primes and gives a systematic way to search for large primes.

The search for large primes

The number (2p – 1) is much larger relative to the value of p and provides opportunities to identify large primes.

When the number (2p – 1) becomes sufficiently large, it is much harder to check whether (2p – 1) is prime – that is, if (2p – 1) dots can be arranged only into a rectangular array with one column or one row.

Fortunately, Édouard Lucas developed a prime number test in 1878, later proved by Derrick Henry Lehmer in 1930. Their work resulted in an efficient algorithm for evaluating potential Mersenne primes. Using this algorithm with hand computations on paper, Lucas showed in 1876 that the 39-digit number (2127 – 1) equals 170,141,183,460,469,231,731,687,303,715,884,105,727, and that value is prime.

Also known as M127, this number remains the largest prime verified by hand computations. It held the record for largest known prime for 75 years.

Researchers began using computers in the 1950s, and the pace of discovering new large primes increased. In 1952, Raphael M. Robinson identified five new Mersenne primes using a Standard Western Automatic Computer to carry out the Lucas-Lehmer prime number tests.

As computers improved, the list of Mersenne primes grew, especially with the Cray supercomputer’s arrival in 1964. Although there are infinitely many primes, researchers are unsure how many fit the type (2p – 1) and are Mersenne primes.

By the early 1980s, researchers had accumulated enough data to confidently believe that infinitely many Mersenne primes exist. They could even guess how often these prime numbers appear, on average. Mathematicians have not found proof so far, but new data continues to support these guesses.

George Woltman, a computer scientist, founded the Great Internet Mersenne Prime Search, or GIMPS, in 1996. Through this collaborative program, anyone can download freely available software from the GIMPS website to search for Mersenne prime numbers on their personal computers. The website contains specific instructions on how to participate.

GIMPS has now identified 18 Mersenne primes, primarily on personal computers using Intel chips. The program averages a new discovery about every one to two years.

The largest known prime

Luke Durant, a retired programmer, discovered the current record for the largest known prime, (2136,279,841 – 1), in October 2024.

Referred to as M136279841, this 41,024,320-digit number was the 52nd Mersenne prime identified and was found by running GIMPS on a publicly available cloud-based computing network.

This network used Nvidia chips and ran across 17 countries and 24 data centers. These advanced chips provide faster computing by handling thousands of calculations simultaneously. The result is shorter run times for algorithms such as prime number testing.

A small rectangle metal chip reading 'nVIDIA'
New and increasingly powerful computer chips have allowed prime-number hunters to find increasingly larger primes. Fritzchens Fritz/Flickr

The Electronic Frontier Foundation is a civil liberty group that offers cash prizes for identifying large primes. It awarded prizes in 2000 and 2009 for the first verified 1 million-digit and 10 million-digit prime numbers.

Large prime number enthusiasts’ next two challenges are to identify the first 100 million-digit and 1 billion-digit primes. EFF prizes of US$150,000 and $250,000, respectively, await the first successful individual or group.

Eight of the 10 largest known prime numbers are Mersenne primes, so GIMPS and cloud computing are poised to play a prominent role in the search for record-breaking large prime numbers.

Large prime numbers have a vital role in many encryption methods in cybersecurity, so every internet user stands to benefit from the search for large prime numbers. These searches help keep digital communications and sensitive information safe.

Jeremiah Bartz, Associate Professor of Mathematics, University of North Dakota

This article is republished from The Conversation under a Creative Commons license. Read the original article.

ooOOoo

I find it unbelievable that there are prizes for the first 100 million-digit prime number and also the first 1 billion-digit prime number. It is so far away from my understanding of these numbers that all I can say is: I find it unbelievable!

Artificial Intelligence and Mars

NASA hasn’t landed humans on Mars yet. But thanks to robotic missions, scientists now know more about the planet’s surface than they did when the movie, The Martian, was released.

Our human knowledge is constantly growing. In many, many directions. Here is a fascinating (well it is to me!) article from The Conversation.

ooOOoo

A decade after the release of ‘The Martian’ and a decade out from the world it envisions, a planetary scientist checks in on real-life Mars exploration

‘The Martian’ protagonist Mark Watney contemplates his ordeal. 20th Century Fox

Ari Koeppel, Dartmouth College

Andy Weir’s bestselling story “The Martian” predicts that by 2035 NASA will have landed humans on Mars three times, perfected return-to-Earth flight systems and collaborated with the China National Space Administration. We are now 10 years past the Hollywood adaptation’s 2015 release and 10 years shy of its fictional timeline. At this midpoint, Mars exploration looks a bit different than how it was portrayed in “The Martian,” with both more discoveries and more controversy.

As a planetary geologist who works with NASA missions to study Mars, I follow exploration science and policy closely. In 2010, the U.S. National Space Policy set goals for human missions to Mars in the 2030s. But in 2017, the White House Space Policy Directive 1 shifted NASA’s focus toward returning first to the Moon under what would become the Artemis program.

Although concepts for crewed missions to Mars have gained popularity, NASA’s actual plans for landing humans on Mars remain fragile. Notably, over the last 10 years, it has been robotic, rather than crewed, missions that have propelled discovery and the human imagination forward.

A diagram showing the steps from lunar missions to Mars missions. The steps in the current scope are labeled 'Human presence on Moon,' 'Practice for Mars Exploration Demo' and 'Demo exploration framework on Mars.' The partial scope step is labeled 'Human presence on Mars.'
NASA’s 2023 Moon to Mars Strategy and Objectives Development document lays out the steps the agency was shooting for at the time, to go first to the Moon, and from there to Mars. NASA

Robotic discoveries

Since 2015, satellites and rovers have reshaped scientists’ understanding of Mars. They have revealed countless insights into how its climate has changed over time.

As Earth’s neighbor, climate shifts on Mars also reflect solar system processes affecting Earth at a time when life was first taking hold. Thus, Mars has become a focal point for investigating the age old questions of “where do we come from?” and “are we alone?

The Opportunity, Curiosity and Perseverance rovers have driven dozens of miles studying layered rock formations that serve as a record of Mars’ past. By studying sedimentary layers – rock formations stacked like layers of a cake – planetary geologists have pieced together a vivid tale of environmental change that dwarfs what Earth is currently experiencing.

Mars was once a world of erupting volcanoes, glaciers, lakes and flowing rivers – an environment not unlike early Earth. Then its core cooled, its magnetic field faltered and its atmosphere drifted away. The planet’s exposed surface has retained signs of those processes ever since in the form of landscape patterns, sequences of layered sediment and mineral mixtures.

Rock shelves layered on top of each other, shown from above.
Layered sedimentary rocks exposed within the craters of Arabia Terra, Mars, recording ancient surface processes. Photo from the Mars Reconnaissance Orbiter High Resolution Imaging Science Experiment. NASA/JPL/University of Arizona

Arabia Terra

One focus of scientific investigation over the last 10 years is particularly relevant to the setting of “The Martian” but fails to receive mention in the story. To reach his best chance of survival, protagonist Mark Watney, played by Matt Damon, must cross a vast, dusty and crater-pocked region of Mars known as Arabia Terra.

In 2022 and 2023, I, along with colleagues at Northern Arizona University and Johns Hopkins University, published detailed analyses of the layered materials there using imagery from the Mars Reconnaissance Orbiter and Mars Odyssey satellites.

By using infrared imagery and measuring the dimensions of surface features, we linked multiple layered deposits to the same episodes of formation and learned more about the widespread crumbling nature of the terrain seen there today. Because water tends to cement rock tightly together, that loose material indicates that around 3.5 billion years ago, that area had a drying climate.

To make the discussions about this area easier, we even worked with the International Astronomical Union to name a few previously unnamed craters that were mentioned in the story. For example, one that Watney would have driven right by is now named Kozova Crater, after a town in Ukraine.

More to explore

Despite rapid advances in Mars science, many unknowns remain. Scientists still aren’t sure of the precise ages, atmospheric conditions and possible signatures of life associated with each of the different rock types observed on the surface.

For instance, the Perseverance rover recently drilled into and analyzed a unique set of rocks hosting organic – that is, carbon-based – compounds. Organic compounds serve as the building blocks of life, but more detailed analysis is required to determine whether these specific rocks once hosted microbial life.

The in-development Mars Sample Return mission aims to address these basic outstanding questions by delivering the first-ever unaltered fragments of another world to Earth. The Perseverance rover is already caching rock and soil samples, including ones hosting organic compounds, in sealed tubes. A future lander will then need to pick up and launch the caches back to Earth.

Sampling Mars rocks could tell scientists more about the red planet’s past, and whether it could have hosted life.

Once home, researchers can examine these materials with instruments orders of magnitude more sensitive than anything that could be flown on a spacecraft. Scientists stand to learn far more about the habitability, geologic history and presence of any signs of life on Mars through the sample return campaign than by sending humans to the surface.

This perspective is why NASA, the European Space Agency and others have invested some US$30 billion in robotic Mars exploration since the 1960s. The payoff has been staggering: That work has triggered rapid technological advances in robotics, telecommunications and materials science. For example, Mars mission technology has led to better sutures for heart surgery and cars that can drive themselves.

It has also bolstered the status of NASA and the U.S. as bastions of modern exploration and technology; and it has inspired millions of students to take an interest in scientific fields.

The Perseverance rover and the Ingenuity helicopter on the Martian surface, with the rover's camera moving to look down at Ingenuity.
A selfie from NASA’s Perseverance Mars rover with the Ingenuity helicopter, taken with the rover’s extendable arm on April 6, 2021. NASA/JPL-Caltech/MSSS

Calling the red planet home?

Colonizing Mars has a seductive appeal. It’s hard not to cheer for the indomitable human spirit while watching Watney battle dust storms, oxygen shortages and food scarcity over 140 million miles from rescue.

Much of the momentum toward colonizing Mars is now tied to SpaceX and its CEO Elon Musk, whose stated mission to make humanity a “multi-planetary species” has become a sort of rallying cry. But while Mars colonization is romantic on paper, it is extremely difficult to actually carry out, and many critics have questioned the viability of a Mars habitation as a refuge far from Earth.

Now, with NASA potentially facing a nearly 50% reduction to its science budget, the U.S. risks dissolving its planetary science and robotic operations portfolio altogether, including sample return.

Nonetheless, President Donald Trump and Musk have pushed for human space exploration to somehow continue to progress, despite those proposed cuts – effectively sidelining the robotic, science-driven programs that have underpinned all of Mars exploration to date.

Yet, it is these programs that have yielded humanity’s richest insights into the red planet and given both scientists and storytellers like Andy Weir the foundation to imagine what it must be like to stand on Mars’ surface at all.

Ari Koeppel, Postdoctoral Scientist in Earth and Planetary Science, Dartmouth College

This article is republished from The Conversation under a Creative Commons license. Read the original article.

ooOOoo

Nothing to add from yours truly except to say that this quote is highly relevant: “Challenges are what make life interesting and overcoming them is what makes life meaningful.” – Joshua J. Marine

(And this was the result of me looking online for quotes and coming across 50 quotes from USA Today.)

Light speed

There is more to this topic that many of us do not know.

Photons are massless. They travel at a speed that 99% of us do not really comprehend. But over to Prof. Jarred Roberts who does comprehend the subject.

ooOOoo

Do photons wear out? An astrophysicist explains light’s ability to travel vast cosmic distances without losing energy

Light, whether from a star or your flashlight, travels at 186,000 miles per second. Artur Debat/Moment via Getty Images

Jarred Roberts, University of California, San Diego

My telescope, set up for astrophotography in my light-polluted San Diego backyard, was pointed at a galaxy unfathomably far from Earth. My wife, Cristina, walked up just as the first space photo streamed to my tablet. It sparkled on the screen in front of us.

“That’s the Pinwheel galaxy,” I said. The name is derived from its shape – albeit this pinwheel contains about a trillion stars.

The light from the Pinwheel traveled for 25 million years across the universe – about 150 quintillion miles – to get to my telescope.

My wife wondered: “Doesn’t light get tired during such a long journey?”

Her curiosity triggered a thought-provoking conversation about light. Ultimately, why doesn’t light wear out and lose energy over time?

Let’s talk about light

I am an astrophysicist, and one of the first things I learned in my studies is how light often behaves in ways that defy our intuitions.

A photo of outer space that shows a galaxy shaped like a pinwheel.
The author’s photo of the Pinwheel galaxy. Jarred Roberts

Light is electromagnetic radiation: basically, an electric wave and a magnetic wave coupled together and traveling through space-time. It has no mass. That point is critical because the mass of an object, whether a speck of dust or a spaceship, limits the top speed it can travel through space.

But because light is massless, it’s able to reach the maximum speed limit in a vacuum – about 186,000 miles (300,000 kilometers) per second, or almost 6 trillion miles per year (9.6 trillion kilometers). Nothing traveling through space is faster. To put that into perspective: In the time it takes you to blink your eyes, a particle of light travels around the circumference of the Earth more than twice.

As incredibly fast as that is, space is incredibly spread out. Light from the Sun, which is 93 million miles (about 150 million kilometers) from Earth, takes just over eight minutes to reach us. In other words, the sunlight you see is eight minutes old.

Alpha Centauri, the nearest star to us after the Sun, is 26 trillion miles away (about 41 trillion kilometers). So by the time you see it in the night sky, its light is just over four years old. Or, as astronomers say, it’s four light years away. Imagine – a trip around the world at the speed of light.

With those enormous distances in mind, consider Cristina’s question: How can light travel across the universe and not slowly lose energy?

Actually, some light does lose energy. This happens when it bounces off something, such as interstellar dust, and is scattered about.

But most light just goes and goes, without colliding with anything. This is almost always the case because space is mostly empty – nothingness. So there’s nothing in the way.

When light travels unimpeded, it loses no energy. It can maintain that 186,000-mile-per-second speed forever.

It’s about time

Here’s another concept: Picture yourself as an astronaut on board the International Space Station. You’re orbiting at 17,000 miles (about 27,000 kilometers) per hour. Compared with someone on Earth, your wristwatch will tick 0.01 seconds slower over one year.

That’s an example of time dilation – time moving at different speeds under different conditions. If you’re moving really fast, or close to a large gravitational field, your clock will tick more slowly than someone moving slower than you, or who is further from a large gravitational field. To say it succinctly, time is relative.

An astronaut floats weightless aboard the International Space Station.
Even astronauts aboard the International Space Station experience time dilation, although the effect is extremely small. NASA

Now consider that light is inextricably connected to time. Picture sitting on a photon, a fundamental particle of light; here, you’d experience maximum time dilation. Everyone on Earth would clock you at the speed of light, but from your reference frame, time would completely stop.

That’s because the “clocks” measuring time are in two different places going vastly different speeds: the photon moving at the speed of light, and the comparatively slowpoke speed of Earth going around the Sun.

What’s more, when you’re traveling at or close to the speed of light, the distance between where you are and where you’re going gets shorter. That is, space itself becomes more compact in the direction of motion – so the faster you can go, the shorter your journey has to be. In other words, for the photon, space gets squished.

Which brings us back to my picture of the Pinwheel galaxy. From the photon’s perspective, a star within the galaxy emitted it, and then a single pixel in my backyard camera absorbed it, at exactly the same time. Because space is squished, to the photon the journey was infinitely fast and infinitely short, a tiny fraction of a second.

But from our perspective on Earth, the photon left the galaxy 25 million years ago and traveled 25 million light years across space until it landed on my tablet in my backyard.

And there, on a cool spring night, its stunning image inspired a delightful conversation between a nerdy scientist and his curious wife.

Jarred Roberts, Project Scientist, University of California, San Diego

This article is republished from The Conversation under a Creative Commons license. Read the original article.

ooOOoo

This remark jumped out at me when I first read the article: ‘In the time it takes you to blink your eyes, a particle of light travels around the circumference of the Earth more than twice.’

The following photograph is the Milky Way.

The image is from Geography Realm.

Despite the fact that the article is far from me understanding it, it doesn’t reduce the wonder and the awe for me of outer space.

The Edwin Hubble Great Debate

The following is more than fascinating; it is an example of how far science has reached; both figuratively and literally.

ooOOoo

One large Milky Way galaxy or many galaxies? 100 years ago, a young Edwin Hubble settled astronomy’s ‘Great Debate’

The Andromeda galaxy helped Edwin Hubble settle a great debate in astronomy. Stocktrek Images via Getty Images

Chris Impey, University of Arizona

A hundred years ago, astronomer Edwin Hubble dramatically expanded the size of the known universe. At a meeting of the American Astronomical Society in January 1925, a paper read by one of his colleagues on his behalf reported that the Andromeda nebula, also called M31, was nearly a million light years away – too remote to be a part of the Milky Way.

Hubble’s work opened the door to the study of the universe beyond our galaxy. In the century since Hubble’s pioneering work, astronomers like me have learned that the universe is vast and contains trillions of galaxies.

Nature of the nebulae

In 1610, astronomer Galileo Galilei used the newly invented telescope to show that the Milky Way was composed of a huge number of faint stars. For the next 300 years, astronomers assumed that the Milky Way was the entire universe.

As astronomers scanned the night sky with larger telescopes, they were intrigued by fuzzy patches of light called nebulae. Toward the end of the 18th century, astronomer William Herschel used star counts to map out the Milky Way. He cataloged a thousand new nebulae and clusters of stars. He believed that the nebulae were objects within the Milky Way.

Charles Messier also produced a catalog of over 100 prominent nebulae in 1781. Messier was interested in comets, so his list was a set of fuzzy objects that might be mistaken for comets. He intended for comet hunters to avoid them since they did not move across the sky.

As more data piled up, 19th century astronomers started to see that the nebulae were a mixed bag. Some were gaseous, star-forming regions, such as the Orion nebula, or M42 – the 42nd object in Messier’s catalog – while others were star clusters such as the Pleiades, or M45.

A third category – nebulae with spiral structure – particularly intrigued astronomers. The Andromeda nebula, M31, was a prominent example. It’s visible to the naked eye from a dark site.

The Andromeda galaxy, then known as the Andromeda nebula, is a bright spot in the sky that intrigued early astronomers.

Astronomers as far back as the mid-18th century had speculated that some nebulae might be remote systems of stars or “island universes,” but there was no data to support this hypothesis. Island universes referred to the idea that there could be enormous stellar systems outside the Milky Way – but astronomers now just call these systems galaxies.

In 1920, astronomers Harlow Shapley and Heber Curtis held a Great Debate. Shapley argued that the spiral nebulae were small and in the Milky Way, while Curtis took a more radical position that they were independent galaxies, extremely large and distant.

At the time, the debate was inconclusive. Astronomers now know that galaxies are isolated systems of stars, much smaller than the space between them.

Hubble makes his mark

Edwin Hubble was young and ambitious. At the of age 30, he arrived at Mount Wilson Observatory in Southern California just in time to use the new Hooker 100-inch telescope, at the time the largest in the world.

A black and white photo of a man looking through the lens of a large telescope.
Edwin Hubble uses the telescope at the Mount Wilson Observatory. Hulton Archives via Getty Images

He began taking photographic plates of the spiral nebulae. These glass plates recorded images of the night sky using a light-sensitive emulsion covering their surface. The telescope’s size let it make images of very faint objects, and its high-quality mirror allowed it to distinguish individual stars in some of the nebulae.

Estimating distances in astronomy is challenging. Think of how hard it is to estimate the distance of someone pointing a flashlight at you on a dark night. Galaxies come in a very wide range of sizes and masses. Measuring a galaxy’s brightness or apparent size is not a good guide to its distance.

Hubble leveraged a discovery made by Henrietta Swan Leavitt 10 years earlier. She worked at the Harvard College Observatory as a “human computer,” laboriously measuring the positions and brightness of thousands of stars on photographic plates.

She was particularly interested in Cepheid variables, which are stars whose brightness pulses regularly, so they get brighter and dimmer with a particular period. She found a relationship between their variation period, or pulse, and their intrinsic brightness or luminosity.

Once you measure a Cepheid’s period, you can calculate its distance from how bright it appears using the inverse square law. The more distant the star is, the fainter it appears.

Hubble worked hard, taking images of spiral nebulae every clear night and looking for the telltale variations of Cepheid variables. By the end of 1924, he had found 12 Cepheids in M31. He calculated M31’s distance as a prodigious 900,000 light years away, though he underestimated its true distance – about 2.5 million light years – by not realizing there were two different types of Cepheid variables.

His measurements marked the end of the Great Debate about the Milky Way’s size and the nature of the nebulae. Hubble wrote about his discovery to Harlow Shapley, who had argued that the Milky Way encompassed the entire universe.

“Here is the letter that destroyed my universe,” Shapley remarked.

Always eager for publicity, Hubble leaked his discovery to The New York Times five weeks before a colleague presented his paper at the astronomers’ annual meeting in Washington, D.C.

An expanding universe of galaxies

But Hubble wasn’t done. His second major discovery also transformed astronomers’ understanding of the universe. As he dispersed the light from dozens of galaxies into a spectrum, which recorded the amount of light at each wavelength, he noticed that the light was always shifted to longer or redder wavelengths.

Light from the galaxy passes through a prism or reflects off a diffraction grating in a telescope, which captures the intensity of light from blue to red.

Astronomers call a shift to longer wavelengths a redshift.

It seemed that these redshifted galaxies were all moving away from the Milky Way.

Hubble’s results suggested the farther away a galaxy was, the faster it was moving away from Earth. Hubble got the lion’s share of the credit for this discovery, but Lowell Observatory astronomer Vesto Slipher, who noticed the same phenomenon but didn’t publish his data, also anticipated that result.

Hubble referred to galaxies having recession velocities, or speeds of moving away from the Earth, but he never figured out that they were moving away from Earth because the universe is getting bigger.

Belgian cosmologist and Catholic priest Georges Lemaitre made that connection by realizing that the theory of general relativity described an expanding universe. He recognized that space expanding in between the galaxies could cause the redshifts, making it seem like they were moving farther away from each other and from Earth.

Lemaitre was the first to argue that the expansion must have begun during the big bang.

The Hubble telescope, which looks like a metal cylinder, floating in space.
Edwin Hubble is the namesake for NASA’s Hubble Space Telescope, which has spent decades observing faraway galaxies. NASA via AP

NASA named its flagship space observatory after Hubble, and it has been used to study galaxies for 35 years. Astronomers routinely observe galaxies that are thousands of times fainter and more distant than galaxies observed in the 1920s. The James Webb Space Telescope has pushed the envelope even farther.

The current record holder is a galaxy a staggering 34 billion light years away, seen just 200 million years after the big bang, when the universe was 20 times smaller than it is now. Edwin Hubble would be amazed to see such progress.

Chris Impey, University Distinguished Professor of Astronomy, University of Arizona

This article is republished from The Conversation under a Creative Commons license. Read the original article.

ooOOoo

So wonderful that in this modern era we can read articles from distinguished scientists in the comfort of our own homes.

Essentially, life is about play

We take our decision from watching the animal kingdom.

A recent post in The Conversation provides the article for today’s blog post.

ooOOoo

At its core, life is all about play − just look at the animal kingdom

David Toomey, UMass Amherst

At Cambridge University Library, along with all the books, maps and manuscripts, there’s a child’s drawing that curators have titled “The Battle of the Fruit and Vegetable Soldiers.”

The drawing depicts a turbaned cavalry soldier facing off against an English dragoon. It’s a bit trippy: The British soldier sits astride a carrot, and the turbaned soldier rides a grape. Both carrot and grape are fitted with horses’ heads and stick appendages.

A child's drawing of two soldiers ridind a grape and a carrot
‘The Battle of the Fruit and Vegetable Soldiers,’ a drawing on the back of a manuscript page from Charles Darwin’s ‘On the Origin of Species,’ attributed to Darwin’s young son Francis. Cambridge University Library, CC BY-ND

It’s thought to be the work of Francis Darwin, the seventh child of British naturalist Charles Darwin and his wife, Emma, and appears to have been made in 1857, when Frank would have been 10 or 11. And it’s drawn on the back of a page of a draft of “On the Origin of Species,” Darwin’s masterwork and the foundational text of evolutionary biology. The few sheets of the draft that survive are pages Darwin gave to his children to use for drawing paper.

Darwin’s biographers have long recognized that play was important in his personal and familial life. The Georgian manor in which he and Emma raised their 10 children was furnished with a rope swing hung over the first-floor landing and a portable wooden slide that could be laid over the main stairway. The gardens and surrounding countryside served as an open-air laboratory and playground.

Play also has a role in Darwin’s theory of natural selection. As I explain in my new book, “Kingdom of Play: What Ball-bouncing Octopuses, Belly-flopping Monkeys, and Mud-sliding Elephants Reveal about Life Itself,” there are many similarities – so many that if you could distill the processes of natural selection into a single behavior, that behavior would be play.

No goal, no direction

Natural selection is the process by which organisms that are best adapted to their environments are more likely to survive, and so able to pass on the characteristics that helped them thrive to their offspring. It is undirected: In Darwin’s words, it “includes no necessary and universal law of advancement or development.”

Through natural selection, the rock pocket mouse has evolved a coat color that hides it from predators in the desert Southwest.

In contrast to foraging and hunting – behaviors with clearly defined goals – play is likewise undirected. When a pony frolics in a field, a dog wrestles with a stick or chimpanzees chase each other, they act with no goal in mind.

Natural selection is utterly provisional: The evolution of any organism responds to whatever conditions are present at a given place and time. Likewise, animals at play are acting provisionally. They constantly adjust their movements in response to changes in circumstances. Playing squirrels, faced with obstacles such as falling branches or other squirrels, nimbly alter their tactics and routes.

Natural selection is open-ended. The forms of life are not fixed, but continually evolving. Play, too, is open-ended. Animals begin a play session with no plan of when to end it. Two dogs play-fighting, for instance, cease playing only when one is injured, exhausted or simply loses interest.

Natural selection also is wasteful, as Darwin acknowledged. “Many more individuals of each species are born than can possibly survive,” he wrote. But in the long term, he allowed, such profligacy could produce adaptations that enable an evolutionary line to become “more fit.”

Keepers noticed that Shanthi, a 36-year-old elephant at the Smithsonian national zoo, liked to make noise with objects, so they gave her horns, harmonicas and other noisemakers.

Play is likewise profligate. It requires an animal to expend time and energy that perhaps would be better devoted to behaviors such as foraging and hunting that could aid survival.

And that profligacy is also advantageous. Animals forage and hunt in specific ways that don’t typically change. But an animal at play is far more likely to innovate – and some of its innovations may in time be adapted into new ways to forage and hunt.

Competing and cooperating

As Darwin first framed it, the “struggle for existence” was by and large a competition. But in the 1860s, Russian naturalist Pyotr Kropotkin’s observations of birds and fallow deer led him to conclude that many species were “the most numerous and the most prosperous” because natural selection also selects for cooperation.

Scientists confirmed Kroptokin’s hypothesis in the 20th century, discovering all manner of cooperation, not only between members of the same species but between members of different species. For example, clown fish are immune to anemone stings; they nestle in anemone tentacles for protection and, in return, keep the anemones free of parasites, provide nutrients and drive away predators.

Play likewise utilizes both competition and cooperation. Two dogs play-fighting are certainly competing, yet to sustain their play, they must cooperate. They often reverse roles: A dog with the advantage of position might suddenly surrender that advantage and roll over on its back. If one bites harder than intended, it is likely to retreat and perform a play bow – saying, in effect, “My bad. I hope we can keep playing.”

River otters at the Oregon Zoo repeatedly separate and reunite while playing in a tub of ice.

Natural selection and play also may both employ deception. From butterflies colored to resemble toxic species to wild cats that squeal like distressed baby monkeys, many organisms use mimicry to deceive their prey, predators and rivals. Play – specifically, play-fighting – similarly offers animals opportunities to learn about and practice deception.

To live is to play

Darwin wrote that natural selection creates “endless forms most beautiful and most wonderful.” Play also creates beauty in countless ways, from the aerial acrobatics of birds of prey to the arcing, twisting leaps of dolphins.

In 1973, Ukrainian-American geneticist Theodosius Dobzhansky published an essay with the take-no-prisoners title “Nothing in Biology Makes Sense Except in the Light of Evolution.” Many biologists would agree. Perhaps the most satisfying definition of life attends not to what it is but to what it does – which is to say, life is what evolves by natural selection.

And since natural selection shares so many features with play, we may with some justification maintain that life, in a most fundamental sense, is playful.

David Toomey, Professor of English, UMass Amherst

This article is republished from The Conversation under a Creative Commons license. Read the original article.

ooOOoo

Prof. Toomey’s analysis is spot-on.

All of life involves some form of play.

Picture Parade Four Hundred and Thirty-Seven

Just a single image today!

That of 50 years ago.

In other words when Apollo 8 was in Lunar Orbit and William Anders, who died on June 7th, aged 90, captured Earth-rise.

This iconic picture shows Earth peeking out from beyond the lunar surface as the first crewed spacecraft circumnavigated the Moon.

Image credit: NASA

What a photograph!

Picture Parade Four Hundred and Thirty-Four

A change from our dear dogs.

I really hope you enjoy these as much as we have!

There is quite a long introduction but it helps enormously in explaining the background to the photographs.

ooOOoo

This image is released as part of the Early Release Observations from ESA’s Euclid space mission. All data from these initial observations are made public on 23 May 2024 – including a handful of unprecedented new views of the nearby Universe.

The Dorado Group of galaxies is one of the richest galaxy groups in the southern hemisphere. Here, Euclid captures signs of galaxies evolving and merging ‘in action’, with beautiful tidal tails and shells visible as a result of ongoing interactions. As Dorado is a lot younger than other clusters (like Fornax), several of its constituent galaxies are still forming stars and remain in the stage of interacting with one another, while others show signs of having merged relatively recently. In size, it sits between larger galaxy clusters and smaller galaxy groups, making it a useful and fascinating object to study with Euclid.

This dataset is enabling scientists to study how galaxies evolve and collide over time in order to improve our models of cosmic history and understand how galaxies form within halos of dark matter, with this new image being a true testament to Euclid’s immense versatility. A wide array of galaxies is visible here, from very bright to very faint. Thanks to Euclid’s unique combination of large field-of-view and high spatial resolution, for the first time we can use the same instrument and observations to deeply study tiny (small objects the size of star clusters), wider (the central parts of a galaxy) and extended (tidal merger tails) features over a large part of the sky.

Scientists are also using Euclid observations of the Dorado Group to answer questions that previously could only be explored using painstakingly small snippets of data. This includes compiling a full list of the individual clusters of stars (globular clusters) around the galaxies seen here. Once we know where these clusters are, we can use them to trace how the galaxies formed and study their history and contents. Scientists will also use these data to hunt for new dwarf galaxies around the Group, as it did previously with the Perseus cluster.

The Dorado Group lies 62 million light-years away in the constellation of Dorado.

All images are: ESA/Euclid/Euclid Consortium/NASA, image processing by J.-C. Cuillandre (CEA Paris-Saclay), G. Anselmi

Composite image of five astronomical views, three at the top, two at the bottom. All are dotted with stars and galaxies against a black background. Striking features are three bright glowing structures in the first image. The second image has an orange veil-like structure spanning across. In the third we see a stunning spiral galaxy with many arms. The fourth image features light from galaxies lying behind a bright cluster distorted into arcs. And the fifth image shows a variety of galaxies in all shapes and sizes

An elongated bright cloudy ellipse, tilted at a 45-degree angle in front a black background dotted with small white stars and galaxies. Above the ellipse floats a smaller, cloudy ellipsoid.

A dark orange filamentary structure seems to enclose stars. Centrally, three bright star-forming regions shine brightly through the orange veil in a traffic-light like formation.

The image shows hundreds of stars, some brighter than others. The stars seem to light up their cloud-like surroundings in purple. A darker structure spans the image in an arch from upper left to bottom right. The bottom of this arch runs into dense clouds forming the darkest part of the image.

This breathtaking image features Messier 78 (the central and brightest region), a vibrant nursery of star formation enveloped in a shroud of interstellar dust. This image is unprecedented – it is the first shot of this young star-forming region at this width and depth.

Today, (May 23rd, 2024) ESA’s Euclid space mission releases five unprecedented new views of the Universe. The never-before-seen images demonstrate Euclid’s ability to unravel the secrets of the cosmos and enable scientists to hunt for rogue planets, use lensed galaxies to study mysterious matter, and explore the evolution of the Universe.

ooOOoo

Fabulous. It is an example of just how clever the science is getting!

I can only look at these images in awe. For example, Messier 78 is part of the Orion constellation, has a radius of five light-years, and is only 1,600 light-years from Planet Earth. (Using the figure from below of the distance of a single light-year, that puts Messier 78 as 1,600 times 6 trillion miles from our planet or 9,600 trillion miles.)

And in case you forgot it, one light year is:

The light-year is a measure of distance, not time. It is the total distance that a beam of light, moving in a straight line, travels in one year. To obtain an idea of the size of a light-year, take the circumference of the earth (24,900 miles), lay it out in a straight line, multiply the length of the line by 7.5 (the corresponding distance is one light-second), then place 31.6 million similar lines end to end. The resulting distance is almost 6 trillion (6,000,000,000,000) miles!

The Quantum Field Theory

This is on the edge of my understanding!

Patrice Ayme recently posted an essay called Relativistic Length Contraction Busts Helium3! As I said in my comment to that post:

“This is far ahead of my knowledge of science. I applaud you for writing this despite me not understanding it”

So it may seem a little strange that I now publish the following. It was published originally on Skeptic. It is quite a long video but, please, settle down and watch it.

ooOOoo

Sean Carroll is creating a profoundly new approach to sharing physics with a broad audience, one that goes beyond analogies to show how physicists really think. He cuts to the bare mathematical essence of our most profound theories, explaining every step in a uniquely accessible way.

Quantum field theory is how modern physics describes nature at its most profound level. Starting with the basics of quantum mechanics itself, Sean Carroll explains measurement and entanglement before explaining how the world is really made of fields. You will finally understand why matter is solid, why there is antimatter, where the sizes of atoms come from, and why the predictions of quantum field theory are so spectacularly successful. Fundamental ideas like spin, symmetry, Feynman diagrams, and the Higgs mechanism are explained for real, not just through amusing stories. Beyond Newton, beyond Einstein, and all the intuitive notions that have guided homo sapiens for millennia, this book is a journey to a once unimaginable truth about what our universe is.

Sean Carroll

Sean Carroll is Homewood Professor of Natural Philosophy at Johns Hopkins University, and Fractal Faculty at the Santa Fe Institute. He is host of the Mindscape podcast, and author of From Eternity to HereThe Particle at the End of the UniverseThe Big Picture, and Something Deeply Hidden. He has been awarded prizes and fellowships by the National Science Foundation, NASA, the American Institute of Physics, the Royal Society of London, and many others. He lives in Baltimore with his wife, writer Jennifer Ouellette. His new book series, The Biggest Ideas in the Universe, includes one volume on Space, Time, and Motion, and this new volume on Quanta and Fields.

Shermer and Carroll discuss:

  • the measurement problem in physics
  • wave functions
  • entanglement
  • fields
  • interactions
  • scale
  • symmetry
  • gauge theory
  • phases
  • matter
  • atoms
  • What is time?
  • Is math all there is? Is math universal?
  • double-slit experiment
  • superposition
  • metaphors in science
  • limitations of models and theories of reality
  • What banged the Big Bang?
  • Why is there something rather than nothing?
  • Second Laws of Thermodynamics and directionality in nature
  • Is there a place for God in scientific epistemology?
  • many interpretations of quantum mechanics
  • multiple dimensions and the multiverse
  • string theory and the multiverse
  • known unknowables: Are there things we can never know, even in principle?
    • God
    • hard problem of consciousness
    • free will/determinism.

ooOOoo

I’m assuming you have watched the video because in a world that is pre-occupied with the trivial this is just the opposite. Sean shares his physics in a profoundly different and powerful way!

Those solar flares

Plenty of news stories to choose from.

A massive solar storm is expected to hit Earth, possibly impacting our communication grids.

NOAA presented a report for May 12th that said:

EVENT:
A coronal mass ejection (CME) is an eruption of solar material. When they arrive at Earth, a geomagnetic storm can result. Watches at this level are very rare.
TIMING:
Several CMEs are anticipated to merge and arrive at Earth on May 12th.
EFFECTS:
The general public should visit our webpage to keep properly informed. The aurora mav become
visible over much of the northern half of the country, and maybe as far south as Alabama to
northern California.

Meanwhile, Earth.com presented the following (and it is a long but extremely interesting report):

Update: New solar flare, secondary peak today in this “Extreme” solar storm

By Eric Ralls, Earth.com staff writer

Update — May 12, 2024 at 8:04 PM EDT

The Sun released another powerful burst of energy today, known as a solar flare, reaching its peak intensity at 12:26 p.m. Eastern Time. The flare originated from a region on the Sun’s surface called sunspot Region 3664, which has been quite active lately.

NASA’s Solar Dynamics Observatory, a spacecraft that keeps a constant eye on our nearest star, was able to capture a striking image of this latest solar outburst.

Solar flares are immense explosions on the Sun that send energy, light and high speed particles into space. They occur when the magnetic fields in and around the Sun reconnect, releasing huge amounts of stored magnetic energy. Flares are our solar system’s most powerful explosive events.

The NOAA’s Space Weather Prediction Center (SWPC) has extended the Geomagnetic Storm Warning until the afternoon of May 13, 2024.

Understanding different classes of solar flares

Today’s flare was classified as an X1.0 flare. Solar flares are categorized into classes based on their strength, with X-class flares being the most intense. The number provides additional information about the flare’s strength within that class. An X1 flare is ten times more powerful than an M1 flare.

These energetic solar eruptions can significantly impact Earth’s upper atmosphere and near-Earth space environment. Strong flares can disrupt high-frequency radio communications and GPS navigation signals. The particle radiation and X-rays from flares can also pose potential risks to astronauts in space.

Additionally, the magnetic disturbances from flares, if particularly strong, have the ability to affect electric power grids on Earth, sometimes causing long-lasting blackouts.

However, power grid problems are more commonly caused by coronal mass ejections (CMEs), another type of powerful solar eruption often associated with strong flares.

Scientists are always on alert, monitoring the Sun for these explosive events so that any potential impacts can be anticipated and prepared for. NASA’s Solar Dynamics Observatory, along with several other spacecraft, help provide this early warning system.

Stay tuned to Earth.com and the Space Weather Prediction Center (SWPC) for updates.

Update — May 12, 2024 at 9:41 AM EDT

The ongoing geomagnetic storm is expected to intensify later today, Sunday, May 12, 2024. Several intense Coronal Mass Ejections (CMEs), traveling from the Sun at speeds up to 1,200 miles per second, are anticipated to reach the Earth’s outer atmosphere by late afternoon.

Over the past two days, preliminary reports have surfaced regarding power grid irregularities, degradation of high-frequency communications, GPS outages, and satellite navigation issues. These disruptions are likely to persist as the geomagnetic storm strengthens.

Auroras visible across the continental United States

Weather permitting, auroras will be visible again tonight over most of the continental United States. This spectacular display of lights is a direct result of the ongoing geomagnetic storm.

The threat of additional strong solar flares and CMEs, which ultimately result in spectacular aurora displays, will persist until the large and magnetically complex sunspot cluster, NOAA Region 3664, rotates out of view of the Earth. This is expected to occur by Tuesday, May 14, 2024.

Solar activity remains at moderate to high levels

Solar activity has been at moderate levels over the past 24 hours. Region 3664 produced an M8.8/2b flare, the strongest of the period, on May 11 at 15:25 UTC. A CME signature was observed, but an Earth-directed component is not suspected.

Solar activity is expected to remain at high levels from May 12-14, with M-class and X-class flares anticipated, primarily due to the flare potential of Region 3664.

Energetic particle flux and solar wind enhancements

The greater than 10 MeV proton flux reached minor to moderate storm levels on May 10. Additional proton enhancements are likely on May 13-14 due to the flare potential and location of Region 3664.

The solar wind environment has been strongly enhanced due to continued CME activity. Solar wind speeds reached a peak of around 620 miles/second on May 12 at 00:55 UTC. 

A strongly enhanced solar wind environment and continued CME influences are expected to persist on May 12-13, and begin to wane by May 14.

Geomagnetic field reaches G4 “Severe” storm levels

The geomagnetic field reached G4 (Severe) geomagnetic storm levels in the past 24 hours due to continued CME activity. 

Periods of G3 (Strong) geomagnetic storms are likely, with isolated G4 levels possible, on May 12. Periods of G1-G3 (Minor-Strong) storming are likely on May 13, and periods of G1 (Minor) storms are likely on May 14.

Stay informed and enjoy the light show

As the geomagnetic storm rages on, we must remain vigilant and prepared for the potential consequences. Monitor official sources for updates on the storm’s progress and any further disruptions to our technological infrastructure. 

Take a moment to step outside tonight and marvel at the incredible auroras painting the night sky — a stunning reminder of the raw power and beauty of our Sun.

While these solar storms can cause temporary inconveniences, they also provide us with an opportunity to reflect on our place in the universe and the awe-inspiring forces that shape our world.

Stay tuned to Earth.com and the Space Weather Prediction Center (SWPC) for updates.

Understanding geomagnetic solar storms

Geomagnetic storms are disturbances in the Earth’s magnetic field caused by the interaction between the solar wind and the planet’s magnetosphere. These storms can have significant impacts on technology, infrastructure, and even human health.

Causes of geomagnetic storms

Geomagnetic storms typically originate from the Sun. They are caused by two main phenomena:

  • Coronal Mass Ejections (CMEs): Massive bursts of plasma and magnetic fields ejected from the Sun’s surface.
  • Solar Flares: Intense eruptions of electromagnetic radiation from the Sun’s surface.

When these events occur, they send charged particles streaming towards Earth at high speeds, which can take anywhere from one to five days to reach our planet.

Effects on Earth’s magnetic field

As the charged particles from CMEs and solar flares reach Earth, they interact with the planet’s magnetic field. This interaction causes the magnetic field lines to become distorted and compressed, leading to fluctuations in the strength and direction of the magnetic field.

Impacts on technology and infrastructure

Geomagnetic storms can have significant impacts on various aspects of modern technology and infrastructure:

  • Power Grids: Strong geomagnetic storms can induce currents in power lines, causing transformers to overheat and potentially leading to widespread power outages.
  • Satellite Communications: Charged particles can damage satellite electronics and disrupt communication signals.
  • GPS and Navigation Systems: Geomagnetic disturbances can interfere with the accuracy of GPS and other navigation systems.
  • Radio Communications: Storms can disrupt radio signals, affecting communication systems that rely on HF, VHF, and UHF bands.

Aurora Foundation

One of the most visually striking effects of geomagnetic storms is the formation of auroras, also known as the Northern and Southern Lights.

As charged particles collide with Earth’s upper atmosphere, they excite oxygen and nitrogen atoms, causing them to emit light in various colors.

Monitoring and forecasting

Scientists continuously monitor the Sun’s activity and use various instruments to detect and measure CMEs and solar flares.

This data helps them forecast the timing and intensity of geomagnetic storms, allowing for better preparedness and mitigation of potential impacts.

Historical geomagnetic storms

Some of the most notable geomagnetic storms in history include:

  • The Carrington Event (1859): The most powerful geomagnetic storm on record, which caused widespread telegraph system failures and auroras visible as far south as the Caribbean.
  • The Halloween Storms (2003): A series of powerful geomagnetic storms that caused power outages in Sweden and damaged transformers in South Africa.
  • The Quebec Blackout (1989): A geomagnetic storm that caused a massive power outage affecting millions of people in Quebec, Canada.

Understanding geomagnetic storms is crucial for protecting our technology-dependent world and mitigating the potential risks associated with these powerful space weather events.

—–

Like what you read? Subscribe to our newsletter for engaging articles, exclusive content, and the latest updates.

Check us out on EarthSnap, a free app brought to you by Eric Ralls and Earth.com.

Hollywood movie to reality?

Where is the global climate going?

The challenge with writing posts, albeit not so often, about the global environment, especially when I am a non-scientist, is that one relies entirely on the words of others. In the case of a recent article, published by The Conversation, the authors are claimed to be specialists, and I do not doubt their credentials.

The three authors are René van Westen who is a Postdoctoral Researcher in Climate Physics, at Utrecht University, Henk A. Dijkstra who is a Professor of Physics, also at Utrecht University, and Michael Kliphuis, a Climate Model Specialist, again at Utrecht University.

So, here is their article:

ooOOoo

Atlantic Ocean is headed for a tipping point − once melting glaciers shut down the Gulf Stream, we would see extreme climate change within decades, study shows

Too much fresh water from Greenland’s ice sheet can slow the Atlantic Ocean’s circulation. Paul Souders/Stone via Getty Images

René van Westen, Utrecht University; Henk A. Dijkstra, Utrecht University, and Michael Kliphuis, Utrecht University

Superstorms, abrupt climate shifts and New York City frozen in ice. That’s how the blockbuster Hollywood movie “The Day After Tomorrow” depicted an abrupt shutdown of the Atlantic Ocean’s circulation and the catastrophic consequences.

While Hollywood’s vision was over the top, the 2004 movie raised a serious question: If global warming shuts down the Atlantic Meridional Overturning Circulation, which is crucial for carrying heat from the tropics to the northern latitudes, how abrupt and severe would the climate changes be?

Twenty years after the movie’s release, we know a lot more about the Atlantic Ocean’s circulation. Instruments deployed in the ocean starting in 2004 show that the Atlantic Ocean circulation has observably slowed over the past two decades, possibly to its weakest state in almost a millennium. Studies also suggest that the circulation has reached a dangerous tipping point in the past that sent it into a precipitous, unstoppable decline, and that it could hit that tipping point again as the planet warms and glaciers and ice sheets melt.

In a new study using the latest generation of Earth’s climate models, we simulated the flow of fresh water until the ocean circulation reached that tipping point.

The results showed that the circulation could fully shut down within a century of hitting the tipping point, and that it’s headed in that direction. If that happened, average temperatures would drop by several degrees in North America, parts of Asia and Europe, and people would see severe and cascading consequences around the world.

We also discovered a physics-based early warning signal that can alert the world when the Atlantic Ocean circulation is nearing its tipping point.

The ocean’s conveyor belt

Ocean currents are driven by winds, tides and water density differences.

In the Atlantic Ocean circulation, the relatively warm and salty surface water near the equator flows toward Greenland. During its journey it crosses the Caribbean Sea, loops up into the Gulf of Mexico, and then flows along the U.S. East Coast before crossing the Atlantic.

Two illustrations show how the AMOC looks today and its weaker state in the future
How the Atlantic Ocean circulation changes as it slows. IPCC 6th Assessment Report

This current, also known as the Gulf Stream, brings heat to Europe. As it flows northward and cools, the water mass becomes heavier. By the time it reaches Greenland, it starts to sink and flow southward. The sinking of water near Greenland pulls water from elsewhere in the Atlantic Ocean and the cycle repeats, like a conveyor belt.

Too much fresh water from melting glaciers and the Greenland ice sheet can dilute the saltiness of the water, preventing it from sinking, and weaken this ocean conveyor belt. A weaker conveyor belt transports less heat northward and also enables less heavy water to reach Greenland, which further weakens the conveyor belt’s strength. Once it reaches the tipping point, it shuts down quickly.

What happens to the climate at the tipping point?

The existence of a tipping point was first noticed in an overly simplified model of the Atlantic Ocean circulation in the early 1960s. Today’s more detailed climate models indicate a continued slowing of the conveyor belt’s strength under climate change. However, an abrupt shutdown of the Atlantic Ocean circulation appeared to be absent in these climate models. https://www.youtube.com/embed/p4pWafuvdrY?wmode=transparent&start=0 How the ocean conveyor belt works.

This is where our study comes in. We performed an experiment with a detailed climate model to find the tipping point for an abrupt shutdown by slowly increasing the input of fresh water.

We found that once it reaches the tipping point, the conveyor belt shuts down within 100 years. The heat transport toward the north is strongly reduced, leading to abrupt climate shifts.

The result: Dangerous cold in the North

Regions that are influenced by the Gulf Stream receive substantially less heat when the circulation stops. This cools the North American and European continents by a few degrees.

The European climate is much more influenced by the Gulf Stream than other regions. In our experiment, that meant parts of the continent changed at more than 5 degrees Fahrenheit (3 degrees Celsius) per decade – far faster than today’s global warming of about 0.36 F (0.2 C) per decade. We found that parts of Norway would experience temperature drops of more than 36 F (20 C). On the other hand, regions in the Southern Hemisphere would warm by a few degrees.

Two maps show US and Europe both cooling by several degrees if the AMOC stops.
The annual mean temperature changes after the conveyor belt stops reflect an extreme temperature drop in northern Europe in particular. René M. van Westen

These temperature changes develop over about 100 years. That might seem like a long time, but on typical climate time scales, it is abrupt.

The conveyor belt shutting down would also affect sea level and precipitation patterns, which can push other ecosystems closer to their tipping points. For example, the Amazon rainforest is vulnerable to declining precipitation. If its forest ecosystem turned to grassland, the transition would release carbon to the atmosphere and result in the loss of a valuable carbon sink, further accelerating climate change.

The Atlantic circulation has slowed significantly in the distant past. During glacial periods when ice sheets that covered large parts of the planet were melting, the influx of fresh water slowed the Atlantic circulation, triggering huge climate fluctuations.

So, when will we see this tipping point?

The big question – when will the Atlantic circulation reach a tipping point – remains unanswered. Observations don’t go back far enough to provide a clear result. While a recent study suggested that the conveyor belt is rapidly approaching its tipping point, possibly within a few years, these statistical analyses made several assumptions that give rise to uncertainty.

Instead, we were able to develop a physics-based and observable early warning signal involving the salinity transport at the southern boundary of the Atlantic Ocean. Once a threshold is reached, the tipping point is likely to follow in one to four decades.

A line chart of circulation strength shows a quick drop-off after the amount of freshwater in the ocean hits a tipping point.
A climate model experiment shows how quickly the AMOC slows once it reaches a tipping point with a threshold of fresh water entering the ocean. How soon that will happen remains an open question. René M. van Westen

The climate impacts from our study underline the severity of such an abrupt conveyor belt collapse. The temperature, sea level and precipitation changes will severely affect society, and the climate shifts are unstoppable on human time scales.

It might seem counterintuitive to worry about extreme cold as the planet warms, but if the main Atlantic Ocean circulation shuts down from too much meltwater pouring in, that’s the risk ahead.

This article was updated to Feb. 11, 2024, to fix a typo: The experiment found temperatures in parts of Europe changed by more than 5 F per decade.

René van Westen, Postdoctoral Researcher in Climate Physics, Utrecht University; Henk A. Dijkstra, Professor of Physics, Utrecht University, and Michael Kliphuis, Climate Model Specialist, Utrecht University

This article is republished from The Conversation under a Creative Commons license. Read the original article.

ooOOoo

I am 79! I like to think that whatever is coming down the wires, so to speak, will be after my death. But that is a cop out for a) I have a son and a daughter who are in their early fifties, b) I have a grandson, my daughter and son-in-law’s young man, who is a teenager, with his birthday next month, and c) I could possibly live for another twenty years.

The challenge is how to bring this imminent catastrophic global change in temperature to the fore. We need a global solution now enforced by a globally respected group of scientists and leaders, and, frankly, I do not see that happening.

All one can do is to hope. Hope that the global community will eschew the present-day extremes of warring behaviour and see the need for change. That is NOW!

So that the Hollywood movie, The Day After Tomorrow, remains a fictional story. And for those that have forgotten the film or who have never seen it, here is a small slice of a Wikipedia report:

The Day After Tomorrow is a 2004 American science fiction disaster film conceived, co-writtendirected, co-produced by Roland Emmerich, based on the 1999 book The Coming Global Superstorm by Art Bell and Whitley Strieber, and starring Dennis QuaidJake GyllenhaalSela WardEmmy Rossum, and Ian Holm. The film depicts catastrophic climatic effects following the disruption of the North Atlantic Ocean circulation, in which a series of extreme weather events usher in climate change and lead to a new ice age.

Wikipedia

And here is a YouTube video:

There we go, folks!